


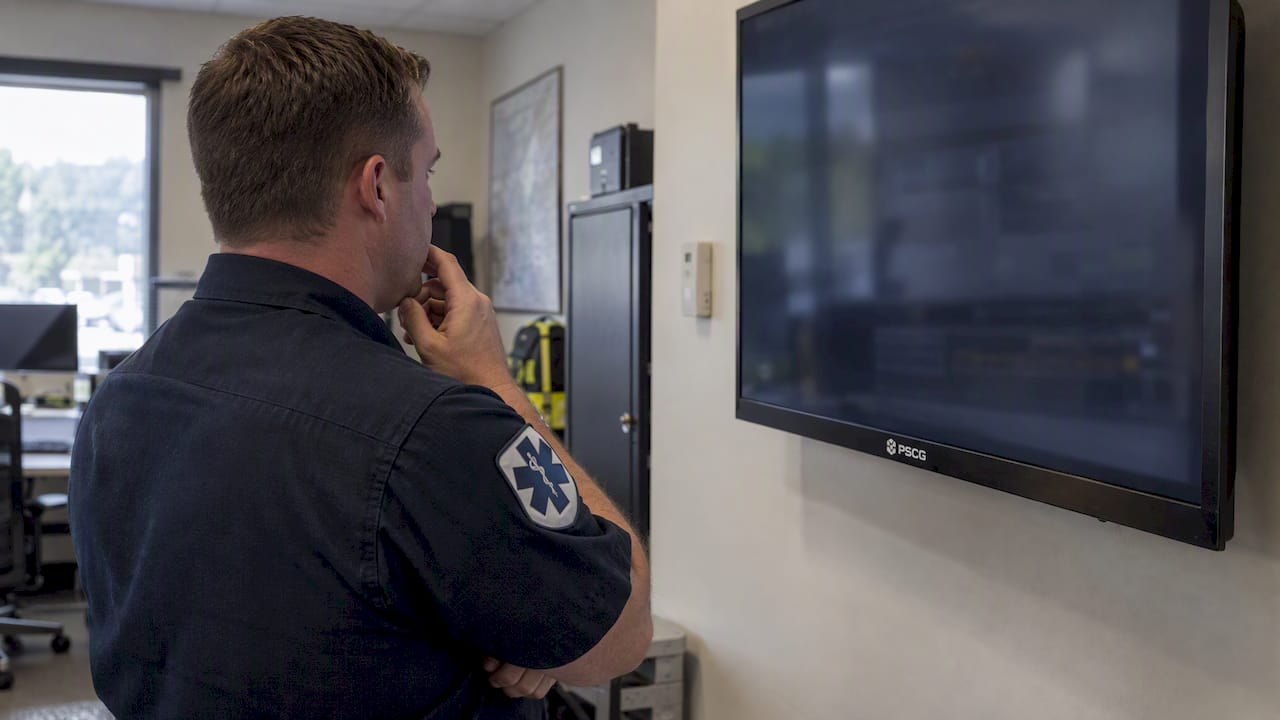
An EMS performance dashboard earns its place when it combines operational measures with clinical measures and benchmarks both against NEMSIS and NEMSQA definitions. Response-time intervals and clinical bundles, such as stroke and STEMI care, are the core elements. You do not have to start from a blank page, because public workbooks and municipal dashboards already exist as working templates.
TL;DR:
- Start with 8–12 priority KPIs, assign each a named data owner, and omit any measure that has no linked decision.
- Set monthly reporting first; add near real time operational views only after data feeds stabilize and supervisors can act on them.
- Segment NEMSIS V3 and NEMSQA benchmark comparisons by urbanicity and service level, using numerator and denominator definitions to compare like with like.
- Connect ePCR and dispatch records with hospital registries, then track weak clinical bundles through quality improvement projects using before and after measures.
Table of Contents
- What do strong EMS dashboard examples look like?
- Which operational and clinical metrics matter most?
- How should you build the data foundation and design?
- How do dashboards drive quality improvement and governance?
- What is the checklist for standing up a dashboard?
- What do leaders most often get wrong about dashboards?
- How can we help you put a dashboard to work?
- FAQ
- Sources
What do strong EMS dashboard examples look like?
Start by studying what other systems publish. Public Tableau workbooks and municipal dashboards tend to share a familiar skeleton: an operations overview, a dispatch interval page, a clinical bundle page, and a stakeholder summary.
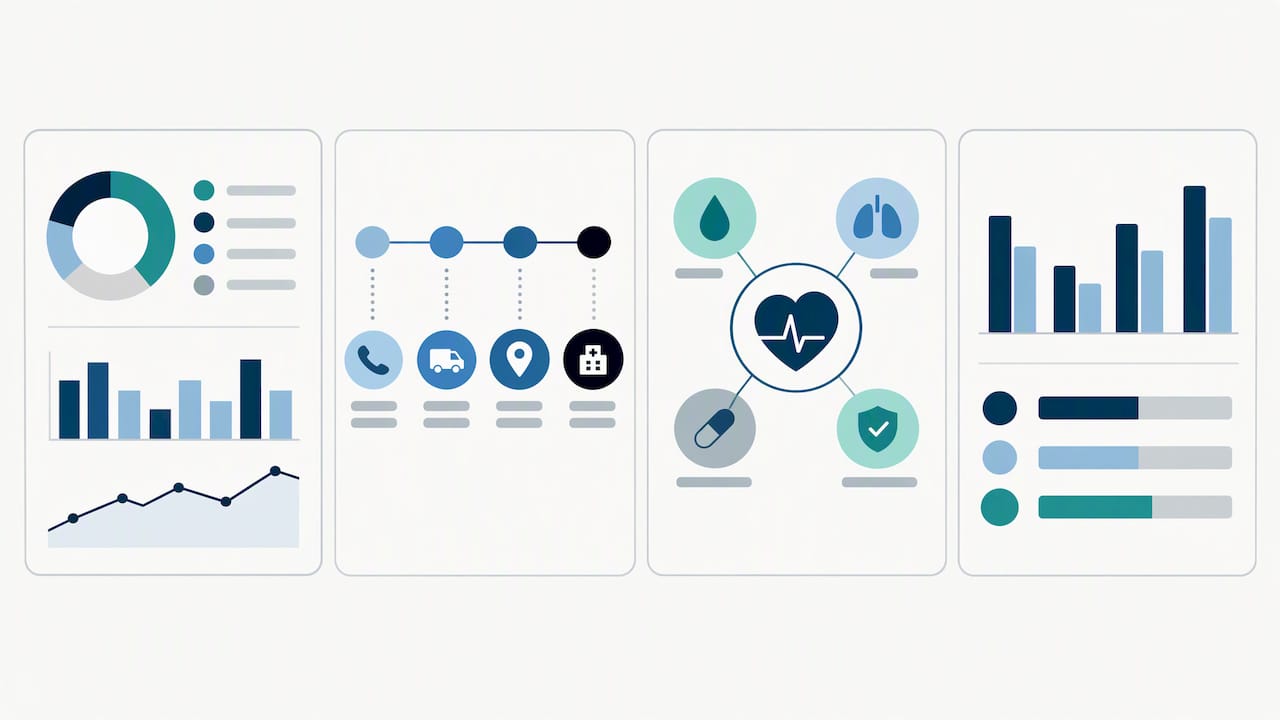
Travis County is a useful reference. Its performance dashboard integrates operational and clinical metrics, updates monthly by the 10th day of the new month, and shares measures with hospitals and stakeholders so improvement becomes a joint effort.
Each page answers a different question:
- Operations overview: Are we meeting our response commitments, and where is demand pushing us?
- Dispatch intervals: Where does time accumulate between the call and the unit moving?
- Clinical bundles: Are time-sensitive milestones for high-acuity patients being met?
- Stakeholder summary: What does the board, the hospital partner or the city manager need to see at a glance?
Update cadence varies. Monthly summaries are the common baseline, while some agencies publish near real-time operational pages. Choose the cadence your data pipeline can sustain, not the one that looks most impressive.
Which operational and clinical metrics matter most?
Pick measures that drive decisions, then define each one precisely.
Operational measures
- Response time intervals, calculated from NEMSIS event times (for example, eTimes.13 minus eTimes.11).
- Overall on-time rate against your contract or policy standard.
- Grade of Service, which tracks call processing times.
- Unit back-in-service, which reveals hospital turnaround and offload delays.
Clinical measures
- Bundles of Care for stroke and STEMI.
- Out-of-hospital cardiac arrest survival.
- Clinical scoring such as REMS or mREMS to quantify prehospital impact.
The JEMS clinical performance article makes the case for grouping clinical KPIs into Bundles of Care so leadership monitors evidence-based milestones instead of aggregate volume. Bundles focus on high-acuity cases, where superior care is essential.
Bundles surface what averages hide. Practitioner guidance recommends grouping clinical KPIs into bundles so dashboards show milestones for high-acuity care rather than masking outcomes in aggregate data.
Where you can, use NEMSIS and NEMSQA numerator and denominator definitions. Shared definitions let you compare your numbers with national data without arguing about what was counted. Our primer on EMS performance metrics walks through individual KPIs in more depth, and our response time analysis resource covers interval math.
How should you build the data foundation and design?
A dashboard is only as trustworthy as the data beneath it. Standardization is what makes benchmarking possible. NEMSIS interoperability guidance stresses that standardizing to NEMSIS data elements is critical, and that calculated intervals such as unit back-in-service help expose system stress like offload delays.
The national picture helps, too. According to the NHTSA Office of EMS annual report, NEMSIS supports national datasets of over 50 million records in 2022 and enables linkages to other datasets, such as hospital registries, to measure system effectiveness.
Connect these pieces in order:
- ePCR and NEMSIS exports for clinical documentation and calculated intervals.
- CAD and dispatch data for call processing and unit status times.
- Hospital registries or health information exchanges for outcomes after handoff.
- The NEMSIS V3 performance measure service, which implements NEMSQA measures and returns numerator and denominator benchmarks your software can query.
The technical guide describes the operations (ListBenchmarks, ListParameters, RetrieveBenchmark) for pulling segmented national benchmarks. Segment by urbanicity and service level so you compare like with like. For layout, give each audience its own page, add trend lines and drilldowns, and lean on bundles so volume does not drown the signal. Our guide to analytics in EMS and our overview of EMS data reporting requirements cover the surrounding architecture.
Pro Tip: Benchmark monthly, but reserve real-time views for operational pages where a supervisor can act on the information.
How do dashboards drive quality improvement and governance?
A dashboard that nobody acts on is wall art. The value shows up when a number changes a decision.
- Run QI loops: Turn a weak bundle or KPI into a PDSA project, then track pre and post measures on the same dashboard so the result is visible.
- Enforce contracts fairly: Use agreed metrics as contract compliance measures, and let the data guide remediation conversations instead of opinion.
- Frame the Triple Aim: Report on patient experience, population health and cost so you can explain why resources matter and defend budgets with evidence.
Shared transparency helps here. When hospitals and city leaders see the same measures, the conversation shifts from whose numbers are right to what we do next.
What is the checklist for standing up a dashboard?
Move quickly, but in the right order.
- Define your goals and audience, then choose 8–12 priority KPIs that mix operational and clinical measures.
- Map each data source and assign a named data owner.
- Start with monthly updates, and add real-time views once the data is stable.
- Publish one executive summary view and one operational drilldown.
- Assign responsibility for data quality and for clinical validation.
Pro Tip: If a KPI has no owner and no decision attached to it, leave it off the first release.
What do leaders most often get wrong about dashboards?
We see the same pitfalls: too many metrics, no ownership, and a cadence that fits nobody’s decisions. What works is the opposite: clarity, governance and bundles. In our system design and System Status Management work, the best results come when a dashboard replaces debate with a shared view of the facts, and leaders can explain a decision in one page.
— Mike
How can we help you put a dashboard to work?
We help public safety agencies turn data into decisions, from dashboard strategy to data integration to day-to-day operationalization. If you want hands-on support, start with our High Performance EMS system design services or reach us through Thepscgroup. Tell us what you need to see, and we will work alongside your team to build it.
FAQ
What should an EMS performance dashboard include?
It should pair operational measures, such as response-time intervals and on-time rate, with clinical measures, such as stroke and STEMI bundles. Add NEMSIS-based benchmarks so you can compare your results with national data.
Where do EMS dashboard benchmarks come from?
The NEMSIS V3 performance measure service implements measures defined by NEMSQA. It lets software retrieve numerator and denominator benchmarks to compare local agency data with national benchmark data.
How often should an EMS dashboard update?
Monthly is a sound starting point, and Travis County, for example, updates its dashboard monthly. Add near real-time pages for operations once your data feeds are stable and someone can act on what they show.
Why use clinical bundles instead of single measures?
Bundles group related milestones for high-acuity care, so leaders see whether the full sequence happened. Practitioner guidance notes that aggregate data can mask these outcomes.