



TL;DR:
- EMS performance metrics assess system quality, efficiency, and patient outcomes through structured domains. Leaders should measure all three domains, benchmark against standards, and use data to guide improvements. Combining clinical, operational, and financial metrics ensures comprehensive EMS system evaluation and sustainability.
EMS performance metrics are standardized indicators that quantify the clinical quality, operational efficiency, and patient outcome effectiveness of emergency medical services. These measures give EMS leaders the evidence they need to evaluate system performance, allocate resources, and drive continuous quality improvement. Organizations like the National EMS Quality Alliance (NEMSQA) and benchmarking programs such as the AIMHI High-Performance EMS study have formalized these indicators into nationally comparable measure sets. Understanding what EMS performance metrics are, and how to use them correctly, is one of the most consequential skills an EMS leader can develop.
What are the core categories of EMS performance metrics?
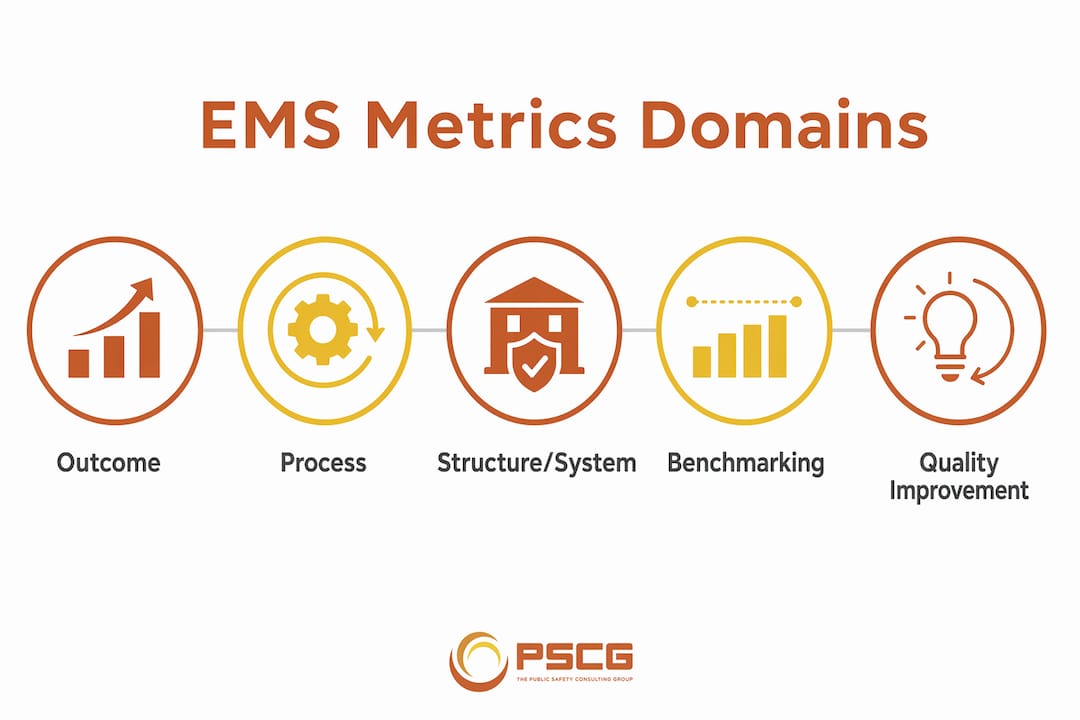
Performance measurement frameworks organize EMS metrics into three distinct domains: Structure/System, Process, and Outcome. Each domain captures a different dimension of service quality, and measuring all three together produces a complete picture of system health.
Structure/System metrics measure the resources and capabilities your agency has in place. These include unit hours available, staffing levels, equipment readiness, and geographic coverage. A system with strong structural metrics has the foundation to perform well, but structural capacity alone does not guarantee good patient care.
Process metrics measure the clinical and operational actions your crews take. These are the metrics that reflect what actually happens during a call. Examples include:
- Percentage of cardiac arrest patients receiving CPR within one minute of arrival
- Rate of 12-lead ECG acquisition in chest pain calls
- Documentation of Glasgow Coma Scale (GCS) and vital signs on every appropriate patient
- Compliance with oxygen delivery protocols for hypoxic patients
- Response time from dispatch to scene arrival
Outcome metrics measure what happens to patients as a result of care. Survival to hospital discharge for cardiac arrest, neurological outcomes, and patient safety event rates all fall into this category. Outcome data is the most meaningful measure of EMS effectiveness, but it is also the hardest to collect because it requires hospital follow-up data that many agencies lack.
The three-domain model matters because agencies that measure only response times miss the full picture. A unit that arrives in four minutes but delivers substandard clinical care has not succeeded. Effective quality management requires tracking all three domains together.
Pro Tip: If your agency only tracks response times and call volume, you are measuring your system’s speed, not its quality. Add at least two clinical process metrics and one outcome metric to your monthly dashboard immediately.
Which specific EMS metrics measure clinical quality and operational efficiency?
Specific, standardized metrics give EMS leaders the precision needed for meaningful quality assurance. The table below organizes the most commonly used indicators by domain.
| Domain | Metric | What It Measures |
|---|---|---|
| Clinical Process | 12-lead ECG acquisition rate | Percentage of chest pain patients receiving a 12-lead ECG |
| Clinical Process | Appropriate oxygen use | Oxygen delivery rate for documented hypoxic patients |
| Clinical Process | GCS and vital sign documentation | Completeness of clinical assessment records |
| Operational | Response time compliance | BLS arrival within 4 minutes, ALS within 8 minutes at 90% of calls |
| Operational | Unit hour utilization | Productive time per unit hour scheduled |
| Financial | Vehicle utilization rate | Percentage of time vehicles are actively deployed |
NEMSQA clinical benchmarks include the percentage of syncope patients receiving a 12-lead ECG and appropriate oxygen use in hypoxic patients as national standards for clinical quality improvement. These measures exist because they are directly tied to patient outcomes and are reliably collectible from electronic patient care records.
On the operational side, NFPA 1750 voluntary benchmarks specify that BLS units should arrive within four minutes and ALS units within eight minutes at least 90% of the time. Failure to meet these benchmarks can trigger contractual penalties in municipal EMS contracts. That consequence makes response time one of the few metrics with direct financial implications for agencies.

AIMHI 2024 benchmarking data shows that high-performing EMS systems report scheduling efficiency reaching up to 90%, with unit hour utilization values directly guiding staffing decisions. These operational benchmarks reveal how well a system converts available resources into productive service delivery.
Financial metrics round out the picture for EMS leaders responsible for budget sustainability. Vehicle utilization rates above 60% are advised as a target for operational efficiency. Contribution margin, which measures revenue minus variable costs per transport, tells leaders whether their service is financially viable at current call volumes.
Pro Tip: Track your EMS response time data by shift and geographic zone, not just system-wide averages. System-wide averages hide the performance gaps that matter most.
How do EMS agencies benchmark and interpret metrics for quality improvement?
Benchmarking is the process of comparing your agency’s performance against external standards or peer systems. Done correctly, it identifies genuine gaps. Done carelessly, it produces misleading conclusions that drive bad decisions.
The most reliable benchmarking sources for EMS agencies are NEMSQA, AIMHI, and NFPA 1750. Standardized measure sets like NEMSQA allow agencies to compare their clinical process metrics against national peers using consistent definitions. That consistency is what makes the comparison valid. Without it, you are comparing different things under the same label.
Context is the most underestimated factor in EMS data interpretation. Benchmarking requires adjusting for local conditions such as geography, population density, and call volume to avoid misleading conclusions. A rural agency covering 400 square miles cannot be fairly compared to an urban system with a unit every half mile. The raw numbers will look different for structural reasons that have nothing to do with performance quality.
Common data misinterpretations EMS leaders should avoid:
- High unit hour utilization as a sign of efficiency. Unit utilization above 60–70% may indicate system strain and risk of crew burnout rather than efficiency. A crew that is constantly busy has no reserve capacity for simultaneous calls or extended incidents.
- Response time compliance as a proxy for clinical quality. Arriving fast is necessary but not sufficient. Process and outcome metrics must accompany response time data.
- Single-month data as a trend. One month of strong performance does not indicate a trend. Longitudinal tracking over 12 months or more reveals whether improvement is real or statistical noise.
Tracking metrics like zero-unit availability and frequency of simultaneous calls shifts resource planning discussions from anecdote to evidence. When leaders can show a governing body exactly how often the system had no available unit, the conversation about staffing changes from opinion to fact.
Pro Tip: Build a peer comparison group of three to five agencies with similar call volumes, geography, and service models. Benchmark against them quarterly using AIMHI or NEMSQA data. That comparison will tell you far more than comparing yourself to national averages.
What practical steps can EMS leaders take to implement performance metrics?
Implementing a performance metrics program requires deliberate structure. The following steps give EMS leaders a clear path from data collection to system improvement.
Adopt a standardized measure set. Start with NEMSQA clinical measures and NFPA 1750 operational benchmarks. Standardization makes your data comparable to peers and defensible to oversight bodies.
Audit your data collection process. Metrics are only as good as the data behind them. Review your electronic patient care reporting system to confirm that required fields are being completed accurately and consistently on every call.
Align staffing with call volume data. Operational data on call load and response intervals should directly inform your unit deployment schedule. If your peak call volume occurs between 10:00 AM and 6:00 PM, your staffing model should reflect that reality.
Use metrics to target training. If your 12-lead ECG acquisition rate is below the NEMSQA benchmark, that is a training gap, not a documentation problem. Identify the specific clinical process failures and build targeted remediation around them. Your EMS clinical protocols should be updated to reflect what the data reveals.
Separate tiered response by acuity. High-performance systems use tiered deployment models to prioritize critical calls for faster response. Routing low-acuity calls to appropriate response levels preserves ALS resources for patients who need them most.
Monitor financial sustainability alongside clinical quality. Clinical excellence and financial viability are not competing goals. Contribution margin and vehicle utilization data tell you whether your current model can sustain the clinical investments you are making.
Report metrics to leadership and governing bodies regularly. Data that stays inside the quality improvement committee has limited impact. Monthly dashboards presented to municipal leaders and medical directors create accountability and build the case for resource investment.
Effective EMS quality assurance programs integrate all of these steps into a continuous cycle rather than treating metrics as an annual reporting exercise. The goal is a living system where data informs decisions in near real time.
Pro Tip: Partner with your medical director to select the three clinical process metrics that most directly reflect your patient population’s needs. Depth on three metrics beats shallow tracking of fifteen.
Key Takeaways
EMS performance metrics are only effective when agencies measure all three domains, benchmark against peer-comparable standards, and use data to drive specific operational and clinical decisions.
| Point | Details |
|---|---|
| Three-domain measurement | Track Structure/System, Process, and Outcome metrics together for a complete performance picture. |
| NEMSQA and NFPA 1750 standards | Use these national benchmarks to set valid performance targets and support peer comparison. |
| Context-adjusted benchmarking | Always account for geography, call volume, and density before comparing your data to national figures. |
| High utilization as a warning sign | Unit hour utilization above 60–70% may signal system strain, not efficiency. |
| Financial metrics matter | Monitor vehicle utilization and contribution margin alongside clinical indicators to sustain operations. |
Why the metrics conversation in EMS is more complex than most leaders realize
I have worked with EMS agencies that had dashboards full of green checkmarks and were still delivering inconsistent care. The metrics looked fine. The reality on the street did not match the numbers. That gap is the most dangerous place an EMS system can be, because leadership stops asking hard questions when the data appears reassuring.
The shift from response-time-only measurement to a three-domain model is real progress. But the next challenge is organizational culture. Data collection is only as honest as the people entering it. If crews feel that accurate documentation leads to punishment rather than support, they will find ways to make the numbers look acceptable. The metrics program then measures compliance with the metrics program, not actual performance.
The agencies I have seen do this well share one trait: their leadership treats every metric as a question, not a verdict. A low 12-lead ECG rate is not evidence that crews are failing. It is a prompt to ask why. Is it a training gap? An equipment issue? A protocol that is unclear? The answer determines the response. That distinction between judgment and inquiry is what separates a metrics program that improves care from one that just generates reports.
I also want to be direct about financial metrics. EMS leaders sometimes treat clinical quality and financial sustainability as separate conversations. They are not. An agency that cannot sustain its operations financially will eventually deliver worse care, regardless of how good its clinical protocols are. Monitoring EMS financial performance is not a concession to business thinking. It is a clinical responsibility.
The most effective EMS leaders I know use metrics to build the case for what their communities need, not to defend the status quo. That is the right use of this data.
— Mike
How Thepscgroup supports EMS leaders with performance consulting
Thepscgroup works directly with EMS agencies and municipal leaders to build performance measurement programs grounded in current national standards. We help agencies select the right metrics, audit data collection processes, and translate performance data into decisions that improve both clinical quality and operational sustainability.

Whether your agency is building a metrics program from the ground up or refining an existing quality improvement process, Thepscgroup brings the expertise to make that work effective. Our municipal EMS strategy services connect performance data to system design decisions, staffing models, and community accountability. We also support EMS system design consulting for agencies ready to align their structure with the outcomes their communities expect. Contact us at thepscgroup.net to start the conversation.
FAQ
What is the definition of EMS performance metrics?
EMS performance metrics are standardized measures used to evaluate the clinical quality, operational efficiency, and patient outcomes of an emergency medical services system. They include indicators across three domains: Structure/System, Process, and Outcome.
What are the most important EMS performance indicators to track?
The most critical indicators include response time compliance against NFPA 1750 benchmarks, clinical process rates such as 12-lead ECG acquisition, unit hour utilization, and patient outcome measures like cardiac arrest survival rates.
How do EMS agencies benchmark their performance?
Agencies benchmark by comparing their data against national standards from NEMSQA, NFPA 1750, and AIMHI, adjusting for local factors like geography and call volume to ensure valid, peer-comparable analysis.
What does high unit hour utilization mean for an EMS system?
Unit hour utilization above 60–70% may indicate system strain and increased risk of crew burnout rather than peak efficiency. High utilization reduces reserve capacity for simultaneous or extended incidents.
How often should EMS leaders review performance metrics?
EMS leaders should review operational metrics monthly and clinical quality metrics at least quarterly. Longitudinal tracking over 12 months or more is required to distinguish genuine performance trends from short-term variation.