



TL;DR:
- Focusing on rapid system improvements like dispatch and hospital offload protocols can significantly reduce EMS response times within days. Understanding root causes such as ED delays, staffing shortages, and static stationing allows targeted interventions to improve coverage efficiently. Implementing dynamic deployment, station modeling, municipal traffic upgrades, and performance monitoring creates a sustainable path to faster, safer response times.
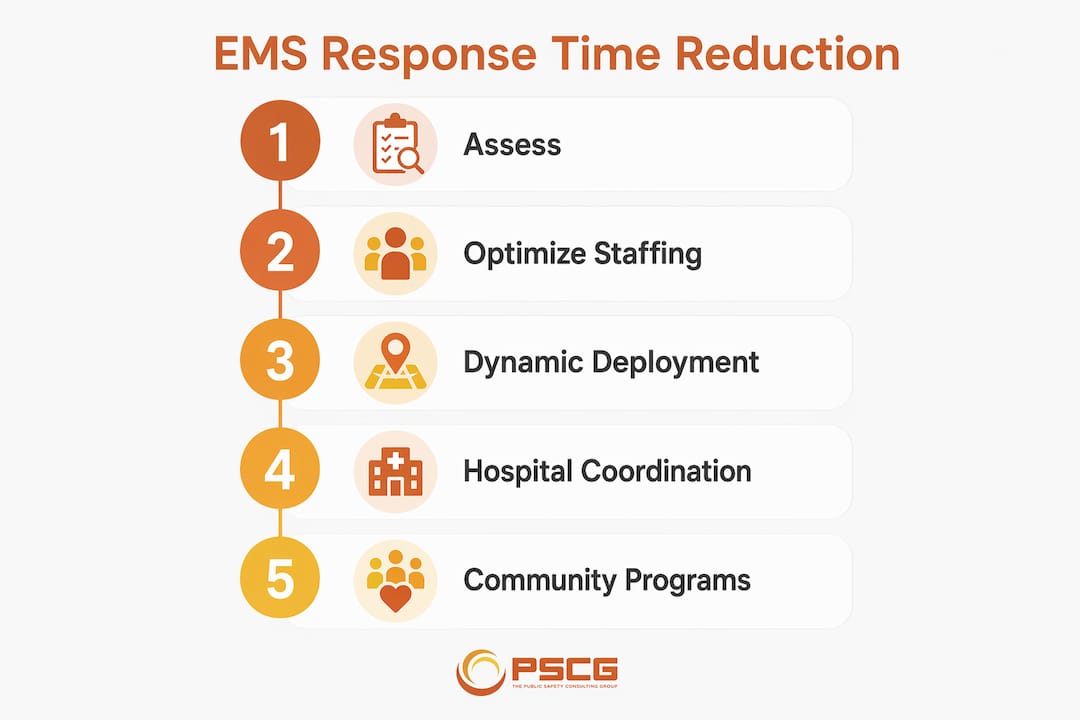
Prioritize dynamic dispatch and hospital offload reduction first. Those two levers deliver the fastest, highest-return cuts in EMS response time, and most agencies can begin acting on both within 72 hours. After that, the sequence is station coverage modeling, community first responder activation, and municipal infrastructure coordination. Here is where to start:
Immediate actions for the next 24–72 hours:
- Audit peak-hour unit positioning against your recent call density data. Reposition one or two units to high-demand zones during peak hours. Estimated impact: potentially reduces average travel time in covered zones.
- Review dispatch call-processing protocols for Priority 1 calls. Identify any steps that can be pre-authorized or parallelized. Estimated impact: potentially reduces call-processing time.
- Establish a direct escalation contact at your primary ED for offload delays exceeding a threshold duration. A single named contact and a text-based alert protocol costs nothing. Estimated impact: can significantly reduce average offload time per delayed unit per shift.
- Activate or verify your CFR/first-responder dispatch integration for confirmed cardiac arrest calls. If your CAD does not auto-notify first responders, set that rule today. Estimated impact: reduces time to first defibrillation, directly improving survival odds.
- Assign an owner for each of the above. Without a named person and a 72-hour check-in, none of these changes hold.
These are not long-term projects. They are operational decisions you can make before the end of the week.
Table of Contents
- What is actually driving your EMS response times longer?
- Workforce tactics that reduce response time
- How dispatch optimization and dynamic deployment cut response time
- Does station location modeling actually improve coverage?
- How to cut ambulance offload time through hospital coordination
- How do community first responders and bystander programs reduce response time?
- What municipal infrastructure changes actually reduce travel time?
- Which KPIs should you actually track, and how?
- What does a realistic implementation roadmap look like?
- What does the research say, and how does PSCG apply it?
- Key Takeaways
- The trade-offs no one talks about in public
- How Thepscgroup helps you move from data to action
- Useful sources and further reading
What is actually driving your EMS response times longer?
Understanding the root causes is not an academic exercise. Each driver below maps directly to a lever you can pull, and misdiagnosing the cause leads to expensive fixes that miss the problem entirely.
Emergency department overcrowding and ambulance offload delays
When a unit arrives at an ED and cannot transfer patient care, it is effectively out of service. That lost availability cascades: the next call in that unit’s zone goes to a farther unit, travel time increases, and if a second call arrives simultaneously, coverage gaps compound. A single unit stuck on offload for 30 minutes during a busy shift can eliminate two or three additional responses from that unit’s coverage area.

This is not a clinical problem. It is a system design and contract management problem, and it belongs on the EMS administrator’s agenda, not just the hospital’s.
Staffing shortages and scheduling gaps
Vacant shifts mean units go unstaffed. Unstaffed units mean longer travel distances for the units that are available. Chronic overtime creates fatigue, which slows turnout times and increases error rates. The staffing crisis in EMS is well-documented across the United States, and it affects both rural systems with thin volunteer bases and urban systems competing for paramedics against hospitals and fire departments.
Static stationing versus fluid demand
Most EMS systems were designed around fixed station locations that made sense when they were built, not necessarily where demand is concentrated today. Population shifts, new commercial corridors, and seasonal variation all change where calls originate. A system that stations units at fixed points regardless of time-of-day demand is leaving coverage efficiency on the table.
Dispatch call-processing delays
The time between a 911 call connecting and a unit being dispatched is a controllable component of total response time. Protocol-driven dispatch systems like MPDS (Medical Priority Dispatch System) improve consistency, but they also add processing steps. Identifying which steps can be streamlined or run in parallel, without compromising triage accuracy, is a measurable improvement opportunity.
Traffic, geography, and infrastructure
In dense urban areas, travel time is often the binding constraint. In rural systems, distance is the dominant factor. Neither is fully controllable, but traffic signal preemption and dynamic routing can recover meaningful minutes in urban corridors.
Rising low-acuity demand
Non-emergency calls dispatched at high priority consume unit hours that should be available for time-critical events. Community paramedicine programs and nurse navigator triage pathways are the structural answer, but even near-term protocol changes to dispatch priority tiering can reduce unnecessary high-speed responses.
A PMC review of EMS performance measurement makes the case clearly: chasing a single average response-time number without componentizing the drivers leads to interventions that improve the metric without improving the system. Measure each component separately.
Workforce tactics that reduce response time
Availability is the upstream variable. If you do not have a staffed unit in the right place, no dispatch optimization or signal preemption program will close the gap.

Recruitment and retention
Targeted hiring campaigns that emphasize career progression, competitive base pay, and schedule flexibility consistently outperform generic job postings in EMS recruitment. Sign-on bonuses help attract candidates, but retention requires something more durable: a visible pathway from EMT-Basic to Advanced EMT to Paramedic, with agency-supported tuition assistance and clinical hours. Agencies that invest in paramedic upgrade pathways reduce their dependency on the external hire market and build institutional knowledge.
Shift flexibility matters more than many administrators expect. Offering 12-hour, 24-hour, and hybrid scheduling options allows the agency to match workforce preferences to coverage needs rather than forcing everyone into a single model that serves neither the employee nor the system.
Alternative staffing models
Split-shift and peak-period surge teams address the mismatch between fixed staffing and variable demand. A surge team that comes on at 7 AM and off at 3 PM, covering the highest-call-volume window, costs less than a full additional unit and delivers coverage exactly where the data shows it is needed.
Cross-training with fire department personnel is another avenue many municipalities have not fully pursued. Where fire-based first responders are already dispatched to medical calls, formalizing their role in patient care handoff and scene management reduces on-scene time and frees the transport unit faster.
Community paramedicine roles serve a dual purpose: they provide career development for experienced paramedics and they divert low-acuity patients away from the 911 system entirely. A community paramedic conducting a follow-up visit for a frequent 911 user is preventing a future unnecessary dispatch.
Pro Tip: The highest-return retention intervention is often the lowest-cost one. Exit interviews consistently show that EMS personnel leave over scheduling inflexibility and lack of recognition before they leave over pay. A structured peer recognition program and a formal schedule-preference process cost almost nothing and measurably reduce turnover.
How dispatch optimization and dynamic deployment cut response time
The short answer: implement dynamic repositioning combined with AI-assisted or forecast-driven deployment for peak coverage, and integrate that capability directly into your CAD system.
Implementation checklist
- Audit your current CAD/AVL integration. Confirm that unit GPS positions update in real time (ideally every 30 seconds or less) and that dispatchers can see unit status and location simultaneously.
- Pull 24 months of call data segmented by time of day, day of week, weather condition, and geographic zone. This is the demand model input.
- Identify your three to five highest-density call zones by hour of day. These become your dynamic staging targets.
- Define repositioning triggers. When a unit clears a call in Zone A and Zone B has elevated demand, the CAD should prompt the dispatcher to reposition rather than return to the home station.
- Evaluate AI-assisted dispatch tools. Recent research on AI-supported emergency platforms shows measurable improvements in dispatch and vehicle response times after implementation.
- Integrate MPDS/AMPDS triage data to reduce misallocated Priority 1 responses. AI-assisted triage can flag calls that do not meet clinical criteria for lights-and-siren response, reducing unnecessary high-speed deployments.
- Define a pilot area. Select one geographic zone for a 60-day A/B comparison. Measure fractile response times, lost unit hours, and dispatch processing time before and after.
- Set success criteria in advance. A reasonable target for a well-designed repositioning pilot is a measurable reduction in average travel time for Priority 1 calls in the pilot zone.
Advanced machine learning models for dynamic repositioning now enable real-time demand forecasting using call volume history, weather feeds, and traffic data. These tools are no longer experimental. Several CAD vendors offer integrated or API-connected forecasting modules, and the operational case for piloting one is strong.
Does station location modeling actually improve coverage?
Yes, and the evidence is specific. Mathematical programming studies on ambulance station relocation demonstrate that applying hierarchical median-type models to station siting increases the proportion of high-priority calls reached within target response times. The model takes call density by geographic grid, available unit hours, and response-time targets as inputs, then identifies the station node configuration that maximizes coverage.
| Model Input | Description | Model Output |
|---|---|---|
| Call density by hex/grid zone | Historical call volume per zone by time of day | Recommended station node locations |
| Unit hours available | Staffed unit availability by shift | Effective coverage fractile per zone |
| Response-time target | Local benchmark (e.g., typical target for Priority 1) | Proportion of calls reachable within target |
| Road network data | Travel time matrix between nodes | Optimal repositioning staging points |
The practical implication: if your system has not conducted a formal station location study in the past five years, you are likely operating with a coverage configuration that no longer matches your call geography. A relocation study does not necessarily mean building new stations. Often, it means identifying two or three interim staging locations where units can be pre-positioned during peak hours at no capital cost.
Pro Tip: Before a full relocation study is complete, use weekday peak-hour staging at high-density commercial or transit hubs as a low-cost interim tactic. Map your top 10% call-density zones and stage one unit there during the 8 AM–6 PM window. This requires no infrastructure and can be evaluated within 30 days.
How to cut ambulance offload time through hospital coordination
Reduce offload delays by formalizing MOCC (Medical Operations Coordination Center) or healthcare coalition escalation channels, establishing standard offload service-level agreements, and implementing real-time ED status sharing between hospitals and dispatch.
The operational mechanics are straightforward. When a unit arrives at an ED and the offload wait exceeds a defined threshold (typically 20–30 minutes), a pre-established escalation protocol should trigger. That protocol might involve a direct call to the charge nurse, a notification to the hospital’s patient flow coordinator, or a MOCC-facilitated diversion to an alternate receiving facility.
MOCC core functions
- Real-time ED bed status monitoring and sharing with dispatch
- Ambulance diversion coordination across multiple receiving facilities
- Interfacility transport coordination to decompress high-volume EDs
- Aggregate data collection on offload times by facility and shift
- Escalation protocols for extended offload events
Healthcare coalitions operating MOCC-style functions have demonstrated measurable reductions in offload time and corresponding recovery of unit hours in systems where the data has been tracked. The unit hours recovered translate directly into improved coverage availability.
Pro Tip: When negotiating or renegotiating hospital service agreements, include a specific offload time clause: a defined maximum offload window (e.g., 30 minutes), a notification requirement when that threshold is approached, and a joint quarterly review of offload data. This language costs nothing to add and creates a shared accountability structure that most hospitals will accept.
How do community first responders and bystander programs reduce response time?
CFR networks and non-transport alternate care pathways reduce time to first intervention and free transport units for high-acuity calls. For cardiac arrest, the gap between collapse and first defibrillation is the single most predictive variable for survival. A community first responder with an AED who arrives two minutes before the ambulance can change that outcome.
Research on CFR and bystander response programs confirms that integrating volunteer responder apps and CFR schemes with dispatch improves bystander response rates and reduces time to first intervention for cardiac arrest.
CFR program design checklist
- Recruitment: Partner with fire departments, community organizations, and trained lay responders. Target neighborhoods with high cardiac arrest incidence and longer EMS travel times.
- Dispatch integration: Configure CAD to auto-notify registered CFRs for confirmed cardiac arrest and unconscious-person calls within a defined radius.
- Training cadence: Require initial CPR/AED certification and annual refreshers. Consider quarterly skills sessions for active responders.
- Legal and Good Samaritan protections: Confirm your state’s Good Samaritan statute covers CFR participants acting in good faith. Most U.S. states provide this protection, but the scope varies. Consult legal counsel before launch.
- Reporting and QA: Track CFR activation rates, arrival times relative to EMS, and patient outcome data. Feed this into your QI cycle.
Non-transport and telehealth diversion pathways
Clinical navigator programs, where a paramedic or nurse reviews low-acuity 911 calls in real time and offers telehealth triage or referral to urgent care, reduce unnecessary ambulance dispatches. This is not a cost-cutting measure in isolation. It is a demand management strategy that preserves transport unit availability for calls that genuinely require it.
What municipal infrastructure changes actually reduce travel time?
Coordinate with your traffic engineering and public works departments to secure traffic signal preemption, EMS-priority signal timing, and designated priority corridors during peak response hours. In dense urban environments, this is one of the highest-return infrastructure investments available to an EMS system.
Municipal levers worth pursuing
- Traffic signal preemption systems (e.g., Opticom or equivalent) that give approaching emergency vehicles a green light cycle, reducing intersection delays on primary response corridors
- EMS-priority signal timing on high-frequency response routes during peak hours, even without full preemption hardware
- Pre-staging agreements for large events, allowing units to position in advance based on predicted demand
- Towing and incident clearance agreements with public works and law enforcement to reduce secondary delays from traffic incidents blocking response routes
- Dedicated EMS-priority lanes on high-volume corridors during peak hours, coordinated with traffic management centers
A signal preemption project typically involves procurement (hardware and software), coordination with the traffic management center, testing and calibration, and municipal approvals. From project initiation to operational deployment, expect a timeline of 12–18 months for a multi-corridor implementation. The stakeholders include the EMS agency, the traffic engineering department, public works, and often the city or county council for budget authorization. Starting with a single high-priority corridor as a pilot reduces both cost and approval complexity.
For a broader view of how these municipal EMS integration strategies fit into a system-wide improvement program, Thepscgroup has published practical guidance to help administrators navigate cross-departmental projects.
Which KPIs should you actually track, and how?
Track fractile response times by priority tier, time-to-patient, ambulance offload time, lost unit hours, and dispatch call-processing time. Avoid using average response time as your sole performance indicator. As a PMC analysis of EMS performance metrics demonstrates, averages mask the distribution of performance and can be improved by reducing outliers at the low end without improving outcomes for the most critical calls.
Recommended KPI dashboard fields
- Fractile response time (90th percentile): The percentage of Priority 1 calls reached within your target time. This is the standard recommended by JEMS and most state EMS offices.
- Call-processing time: From 911 answer to unit dispatch. Target varies by system, but 60–90 seconds is a common benchmark for Priority 1 calls.
- Turnout time: From dispatch notification to unit en route. Benchmarks typically target under 60–90 seconds for Priority 1.
- Travel time: From unit en route to arrival on scene.
- Time-to-patient: From 911 call receipt to first patient contact.
- Offload time: From unit arrival at ED to unit available for next call.
- Lost unit hours: Total unit time unavailable due to offload delays, mechanical issues, or administrative holds.
PerformanceStat review cadence
Run monthly data reviews with your operations leadership team, using the KPI dashboard as the agenda. Weekly exception reports should flag any shift or zone where fractile performance fell below threshold. After-action reviews for significant response-time breaches should be completed within five business days and should produce a documented corrective action. This cadence, modeled on PerformanceStat-style governance, creates the accountability loop that turns measurement into operational change. The JEMS framework for response-time measurement reinforces this: fractile reporting paired with component-time analysis is the standard that drives the right decisions.
What does a realistic implementation roadmap look like?
Sequence your interventions by speed of impact and capital requirement. Dispatch and offload fixes come first because they are low-cost and fast. Station modeling and signal preemption require longer lead times and larger budgets.
| Milestone | Timeline | Priority Actions | Cost Range |
|---|---|---|---|
| 30-day pilot | Days 1–30 | Peak-hour staging, dispatch protocol review, ED escalation contact | Low-cost range |
| 90-day scale | — | CAD/AVL audit, CFR dispatch integration, MOCC contact protocol | Moderate cost range |
| 180-day build | — | Station location study, AI dispatch pilot, MOCC formalization | Medium budget range |
| 365-day infrastructure | — | Signal preemption procurement, station relocation (if indicated), community paramedicine launch | Higher budget investments |
Cost ballparks and ROI expectations
- Dispatch protocol and peak-hour staging: Near-zero direct cost. ROI is measured in unit hours recovered and fractile improvement, typically visible within 30–60 days.
- CAD/AVL upgrades and AI dispatch modules: Costs vary by vendor and existing infrastructure. Published evidence on AI-assisted dispatch platforms supports measurable improvement in dispatch and vehicle response times.
- Station location study: Typically a consulting engagement. The coverage improvements from relocation can reduce the need for additional units, generating long-term cost avoidance.
- Signal preemption (multi-corridor): Capital cost varies by corridor count and existing infrastructure. Travel time savings on high-frequency corridors can be substantial in dense urban systems.
Risk checklist
- Safety risk from high-speed response: Reducing unnecessary Priority 1 dispatches through better triage is a safety intervention, not just an efficiency one. Track lights-and-siren response rates as a safety KPI.
- Union and HR considerations: Scheduling changes and surge team models require early engagement with labor representatives. Build that into your 30-day plan.
- Hospital pushback on offload SLAs: Frame offload agreements as a shared patient safety issue, not a contract dispute. Data on lost unit hours and downstream call coverage gaps is your most persuasive tool.
- Budget approval timelines: Signal preemption and station relocation require capital appropriation. Begin the political groundwork at the 90-day mark, not the 180-day mark.
What does the research say, and how does PSCG apply it?
The evidence base for EMS response-time improvement has matured significantly. Three research streams are directly applicable to U.S. EMS administrators right now.
AI-assisted dispatch has moved from pilot to operational in several systems. The research on internet-based emergency platforms with AI support shows improved dispatch and vehicle response times, and the operational case for piloting an AI triage or repositioning module is well-supported.
Relocation modeling using hierarchical median-type approaches is the current standard for station siting studies. The Springer modeling study demonstrates coverage improvements that are difficult to achieve through staffing increases alone.
Machine learning demand forecasting represents the next generation of dynamic deployment. The 2025 BMC analysis shows that ML models using real-time inputs can reduce response time variability by enabling proactive repositioning rather than reactive dispatch.
Thepscgroup applies these research findings through structured system assessments, pilot design, and facilitated performance reviews. Our EMS system design work includes applied case examples and a data intake checklist that agencies can use to assess readiness before committing to a full pilot.
PSCG readiness assessment checklist
| Data Element | Why It Matters | Who Provides It |
|---|---|---|
| 24 months of CAD call data | Demand modeling and peak-hour analysis | Communications center |
| Unit GPS/AVL logs | Travel time and repositioning analysis | Fleet/IT |
| Offload time records by facility | Lost unit hour calculation | EMS operations |
| Staffing and vacancy data | Availability modeling | HR/scheduling |
| Current station locations and coverage map | Baseline coverage fractile | Operations/GIS |
| Existing KPI reports | Baseline performance benchmarks | QI/administration |
For a detailed methodology, Thepscgroup’s response-time analysis resources walk through the measurement framework and data intake process step by step.
Key Takeaways
Reducing EMS response times requires componentized measurement, dynamic deployment, and coordinated offload management — not a single technology purchase or staffing increase.
| Point | Details |
|---|---|
| Componentize your measurement | Track fractile times, offload time, and lost unit hours separately; averages alone mislead operational decisions. |
| Fix dispatch and offload first | These two levers are the fastest, lowest-cost path to measurable response-time improvement. |
| Model your station coverage | Hierarchical median-type relocation modeling increases the share of Priority 1 calls reached within target time. |
| Build a PerformanceStat cadence | Monthly data reviews and weekly exception reports turn measurement into operational accountability. |
| Thepscgroup as your partner | Thepscgroup provides EMS system design, dispatch evaluation, stationing studies, and facilitated performance reviews to move agencies from data to action. |
30-day actions:
- Assign a named owner for peak-hour staging and dispatch protocol review (Operations Director)
- Establish ED escalation contact protocol (EMS Medical Director + Hospital Liaison)
- Pull 24 months of CAD data for demand analysis (Communications Center Manager)
90-day actions:
- Complete CAD/AVL audit and identify repositioning trigger rules (IT + Operations)
- Activate or verify CFR dispatch integration for cardiac arrest calls (Dispatch Supervisor)
- Draft MOCC escalation protocol and present to hospital partners (EMS Director)
365-day actions:
- Commission station location study using relocation modeling (EMS Director + Consultant)
- Launch signal preemption procurement process with traffic engineering (Municipal Manager)
- Evaluate community paramedicine program design and funding (EMS Director + Finance)
The trade-offs no one talks about in public
Speed and safety are not always aligned. Every administrator who has pushed for faster response times has eventually faced the same uncomfortable data point: lights-and-siren responses carry real risk, both for crews and for the public. The pressure to hit a fractile target can, if not managed carefully, incentivize high-speed responses on calls that do not clinically require them.
The political reality is equally complicated. Elected officials want faster response times because constituents want faster response times. What they do not always want to hear is that the fastest path to improvement involves renegotiating hospital agreements, restructuring dispatch protocols, and sometimes closing or relocating stations. Each of those actions has a constituency that will push back.
Here is the practical advice for building executive and political support:
- Lead with outcome data, not process data. Elected officials respond to survival rates and community health outcomes. Frame response-time improvements in terms of cardiac arrest survival, stroke outcomes, and trauma mortality, not fractile percentages.
- Quantify the cost of inaction. Lost unit hours from offload delays, overtime costs from staffing gaps, and liability exposure from coverage failures are all translatable into dollar figures that budget committees understand.
- Sequence your asks. Bring low-cost, high-impact wins to the council first. A successful 30-day staging pilot is the best argument for the 365-day capital investment.
- Engage labor early. Scheduling and deployment changes that bypass union input create resistance that slows implementation. Early engagement converts potential opponents into co-owners of the solution.
- Be honest about trade-offs. A system that pursues response-time targets at the expense of crew safety or clinical appropriateness will eventually produce an incident that sets the entire program back. Build safety metrics into every performance review alongside speed metrics.
The leaders who sustain improvement over time are not the ones who found the perfect solution. They are the ones who built the organizational culture and governance structures to keep improving, even when the data is uncomfortable.
How Thepscgroup helps you move from data to action
Reducing response times is a systems problem, and Thepscgroup is built to solve it. We work alongside EMS agencies, municipal leaders, and fire departments to design and implement the specific interventions this article describes: dispatch and CAD evaluation, station location and relocation studies, MOCC design and hospital coordination frameworks, PerformanceStat facilitation, and full EMS system design engagements.
Our approach starts with a structured readiness assessment, not a generic audit. We identify the two or three highest-impact levers for your specific system, design a pilot that produces measurable results within 90 days, and build the governance structure to sustain improvement after we leave.
If your agency is ready to move from identifying the problem to fixing it, the next step is a direct conversation. Review our EMS system design examples to see how we have approached similar challenges, or visit our EMS system design consulting page to learn more about our full service offering.
Contact us at thepscgroup.net to schedule a consultation.
Useful sources and further reading
| Source | Description | Best Used For |
|---|---|---|
| Response time as a sole performance indicator in EMS (PMC) | Peer-reviewed analysis of measurement pitfalls and balanced KPI frameworks | Governance briefings, QI program design |
| AI-assisted dispatch platforms (journal DOI) | Study on AI-supported emergency platforms and dispatch time improvements | Technology pilot proposals, grant applications |
| Ambulance station relocation modeling | Mathematical programming study on coverage improvements through relocation | Station siting studies, capital budget justification |
| ML-based EMS demand forecasting (BMC, 2025) | Machine learning analysis of dynamic repositioning and response time variability | Technology roadmap, predictive deployment pilots |
| Response Times: Myths, Measurement and Management (JEMS) | Operational article on fractile reporting and component-time management | Performance review design, elected official briefings |
| EMS Quality Improvement Programs | Clinical and operational QI frameworks including PDSA cycles for EMS | QI program development, training program design |
| Community responder programs and response times (LifeLine EMS) | Programmatic overview of CFR and app-based bystander alerting | CFR program proposals, community engagement planning |
| EMS system design examples (PSCG) | Applied case studies and municipal best-practice guidance from PSCG | Pilot design, proof points for elected officials |
| Response-time analysis resources (PSCG) | Measurement methodology and data intake checklist for readiness assessments | Pre-pilot data collection, baseline analysis |
For grant applications: The PMC peer-reviewed sources and the Springer relocation modeling study carry the citation weight that federal and state grant reviewers expect. Lead with those.
For governance briefings: The JEMS fractile reporting article and the StatPearls QI framework are accessible to non-clinical audiences and translate well into council presentations.
For technical pilots: The BMC machine learning study and the AI dispatch platform research provide the technical foundation for a vendor evaluation or RFP process.