



Predictive analytics is the practice of using historical data, statistical modeling, and machine learning to forecast future outcomes. Rather than simply describing what happened, it answers the harder question: what is likely to happen next? Platforms like Google Cloud have built entire product ecosystems around this capability, and techniques ranging from linear regression to deep neural networks all serve the same core purpose: turning past patterns into forward-looking decisions.
At its foundation, predictive analytics depends on a few essential elements:
- Historical data that is clean, relevant, and representative of the problem you are trying to solve
- Statistical or machine learning models trained to identify patterns within that data
- Validation processes that test model accuracy against data the model has never seen
- Deployment infrastructure that puts predictions into the hands of decision-makers in real time
The field sits at the intersection of statistics, computer science, and domain expertise. No single algorithm wins every problem. What separates a useful predictive model from an expensive exercise is how well the underlying question was defined before any data was touched.
How predictive analytics works: process and core techniques
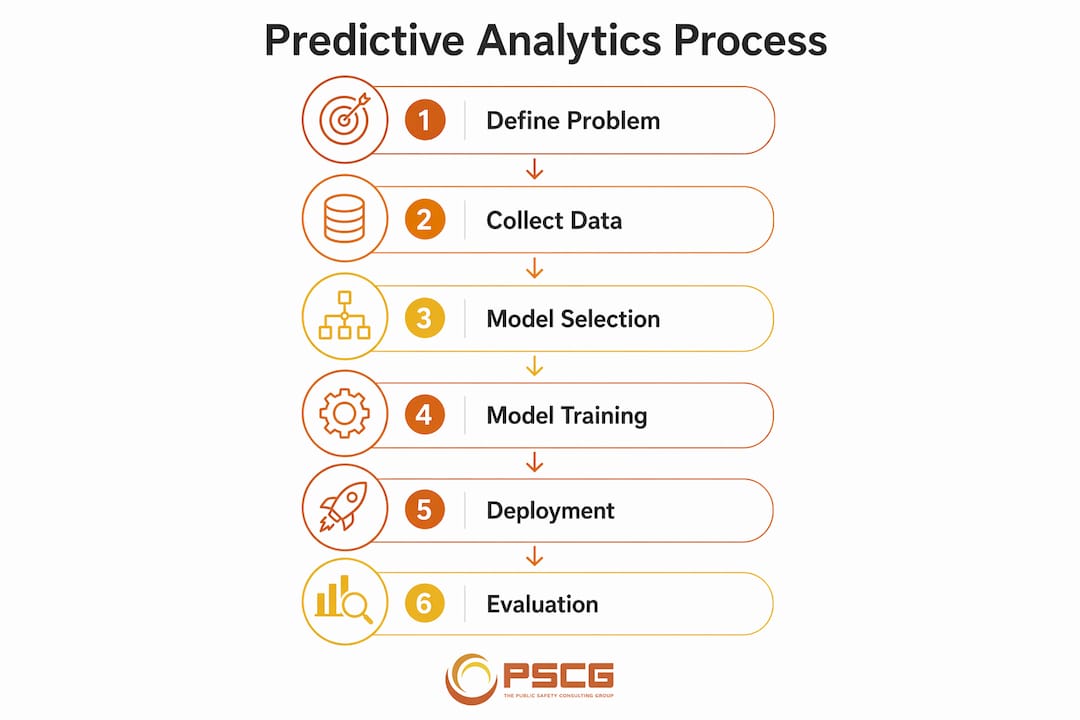
Building a predictive model follows an iterative workflow that moves through data cleaning, feature selection, preprocessing, model training, validation, and deployment. Each stage feeds back into the previous one. A model that performs poorly in validation often reveals a data quality problem, not an algorithm problem.
The core workflow looks like this:
- Data collection and cleaning: Remove duplicates, handle missing values, and address outliers. Data quality is the single biggest determinant of model performance, more so than algorithm complexity.
- Feature engineering: Select and transform the input variables that best represent the problem.
- Model selection: Choose an algorithm suited to the data type and prediction goal.
- Training: Fit the model on a labeled dataset (supervised learning) or allow it to find structure on its own (unsupervised learning).
- Validation: Test the model on unseen data to measure real-world accuracy.
- Deployment: Integrate the model into a workflow, dashboard, or automated decision system.
Supervised learning methods, including regression and decision trees, require labeled training data where the correct answer is already known. Unsupervised methods like clustering and factor analysis find hidden groupings without predefined labels. Both approaches have legitimate uses depending on the problem.
The most widely used modeling techniques include:
- Linear regression: Predicts a continuous numeric outcome, such as call volume or revenue.
- Logistic regression: Classifies outcomes into categories, such as “high risk” or “low risk.”
- Decision trees: Split data along decision rules, producing interpretable if-then logic.
- Neural networks: Layer interconnected nodes to detect complex, nonlinear patterns.
- Clustering: Groups similar observations together without predefined labels.
- Time series models: Analyze data ordered by time to forecast future values, such as seasonal demand.
Pro Tip: Define the business decision you need to make before you select a modeling technique. Organizations that start with the technology rather than the question tend to build models that are technically sound but operationally useless.

Where predictive analytics delivers real results across industries
The practical value of data forecasting techniques becomes clearest when you see them applied to specific, high-stakes decisions. Across banking, healthcare, marketing, manufacturing, and public safety, the same core methods produce measurably different outcomes.

Industry applications span credit scoring, patient risk stratification, campaign targeting, equipment maintenance, and emergency response planning. Each use case draws on a different modeling approach, but all share the same logic: use what you know about the past to reduce uncertainty about the future.
| Industry | Use Case | Primary Technique | Key Benefit |
|---|---|---|---|
| Banking | Credit default risk scoring | Logistic regression | Reduced loan losses |
| Healthcare | Sepsis and readmission prediction | Neural networks | Earlier intervention |
| Marketing | Customer churn and campaign targeting | Decision trees, clustering | Higher conversion rates |
| Manufacturing | Predictive equipment maintenance | Time series, regression | Reduced downtime |
| Public Safety | Call volume forecasting, resource deployment | Time series, regression | Faster response times |
Public safety deserves particular attention here. EMS agencies and fire departments generate enormous volumes of operational data, including call timestamps, unit locations, response times, and patient acuity scores. Applying machine learning analytics to that data can reveal when and where demand will spike, which units are most likely to be unavailable, and which patients face the highest risk of deterioration. Thepscgroup works directly with public safety agencies to translate that kind of data into operational decisions, and the role of analytics in EMS is a subject we address in depth.
In banking, logistic regression models assess the probability that a borrower will default, drawing on credit history, income ratios, and behavioral signals. In healthcare, neural networks trained on electronic health records can flag sepsis risk hours before clinical symptoms become obvious. Marketing teams use clustering to segment customers by behavior and decision trees to predict which offer a given segment will respond to. Manufacturers apply time series models to sensor data from equipment, scheduling maintenance before a failure occurs rather than after.
Expert insights on building predictive analytics that actually work
The most common failure mode in predictive analytics is not a bad algorithm. It is a poorly defined problem. Organizations that focus on technology before understanding the decisions their predictions need to drive tend to build models that impress in demos and disappoint in production.
“Predictive models identify patterns in data, but patterns are not causes. A model that predicts which patients will be readmitted within 30 days does not tell you why they are readmitted. Supplementing statistical output with clinical or operational domain expertise is what turns a correlation into a decision.”
— Grounded in findings from peer-reviewed research on predictive modeling limitations
Three challenges consistently separate teams that get value from predictive analytics from those that do not.
Correlation versus causation. A model may find that ambulance response times are longer on Tuesday afternoons. That correlation is real, but acting on it requires understanding whether the cause is shift overlap, traffic patterns, or call volume distribution. Causal reasoning and domain expertise fill the gap that statistics alone cannot.
Model interpretability. Mathematical models built on equations are easier to explain to regulators, administrators, and frontline staff than deep neural networks. In risk-sensitive environments like healthcare or public safety, a model that no one can explain is a model that no one will trust. The trade-off between interpretability and raw accuracy is a real design decision, not a technical detail.
Forecast horizon. Accuracy declines as the forecast window extends. A model predicting call volume for the next four hours is far more reliable than one projecting six months out. Short-term, granular forecasts tend to drive better operational decisions than long-range projections.
The integration of generative AI with predictive analytics is reshaping how organizations act on forecasts. Rather than presenting a prediction to a human who then decides what to do, AI-assisted systems can translate a forecast directly into a recommended action, or even execute it automatically. This shift from forecasting to intelligent agent behavior is where the field is heading.
Thepscgroup brings this kind of analytical rigor to public safety consulting. We work alongside agencies to evaluate their data infrastructure, identify the decisions that matter most, and build forecasting approaches that field supervisors can actually use. If you are evaluating how your agency uses data, our work on fire department response models offers a practical starting point.
For professional services firms looking to apply predictive segmentation to their own client development, prospect segmentation is a closely related discipline worth exploring.
Frequently asked questions about predictive analytics
What is predictive analytics, and how does it differ from descriptive analytics?
Descriptive analytics summarizes what has already happened. Predictive analytics uses that historical record, combined with statistical models, to estimate what is likely to happen next. The distinction is the direction of the question: backward versus forward.
What data do you need to build a predictive model?
You need historical records that include the outcome you want to predict, along with the input variables that plausibly influence it. Data quality matters more than volume. A clean dataset of moderate size consistently outperforms a large dataset full of errors and missing values.
What are the most common predictive analytics algorithms?
The most widely used algorithms include logistic and linear regression, decision trees, neural networks, clustering, and time series models. Each suits a different data type and prediction goal. Regression works well for continuous outcomes; decision trees are strong for classification problems where interpretability matters.
What are the main ethical concerns in predictive analytics?
Bias in training data is the primary concern. A model trained on historical decisions that reflected systemic inequities will reproduce those inequities at scale. Transparency, regular auditing, and diverse data sources are the standard mitigations. In public safety and healthcare, where model outputs affect people’s lives directly, these considerations carry real weight.
How do you know if a predictive model is performing well?
Model performance depends on the type of prediction. Classification models are evaluated using accuracy, precision, recall, and the area under the ROC curve. Regression models use mean absolute error and root mean squared error. The right metric depends on what kind of mistake is most costly in your specific context.
How to evaluate whether your predictive model is actually performing
Choosing the right evaluation metric is as consequential as choosing the right algorithm. A model that looks accurate by one measure can be dangerously misleading by another.
For classification models (predicting a category, such as “will default” or “will not default”), the core metrics are:
- Accuracy: The percentage of predictions that are correct. Useful when classes are balanced, misleading when they are not.
- Precision: Of all the cases the model flagged as positive, how many actually were? High precision means fewer false alarms.
- Recall (sensitivity): Of all the actual positive cases, how many did the model catch? High recall means fewer missed cases.
- F1 score: The harmonic mean of precision and recall, useful when you need to balance both.
- AUC-ROC: The area under the receiver operating characteristic curve, measuring how well the model separates classes across all decision thresholds.
For regression models (predicting a number, such as response time or revenue), the standard metrics are:
- Mean Absolute Error (MAE): The average size of prediction errors, in the same units as the outcome.
- Root Mean Squared Error (RMSE): Similar to MAE but penalizes large errors more heavily.
- R-squared: The proportion of variance in the outcome that the model explains.
The choice between precision and recall is not neutral. In a sepsis prediction model, missing a true case (low recall) is far more dangerous than a false alarm. In a fraud detection system, too many false positives create operational costs that erode trust in the model. Defining which error is more costly before you train the model shapes every subsequent decision about thresholds and trade-offs.
Validation on held-out data is non-negotiable. A model that performs well on its training data but poorly on new data is overfitting, meaning it has memorized the training set rather than learned a generalizable pattern. Cross-validation, where the dataset is split multiple times and the model is tested on each split, gives a more reliable estimate of real-world performance.
Key Takeaways
Predictive analytics produces value only when clean data, well-chosen models, and clearly defined business problems work together from the start.
| Point | Details |
|---|---|
| Define the problem first | Selecting a technique before defining the decision leads to models that work technically but fail operationally. |
| Data quality drives outcomes | Clean data with managed outliers and missing values outperforms a larger but messier dataset every time. |
| Match the metric to the cost of error | Precision, recall, and RMSE each measure different failure modes; choose based on what mistake is most costly. |
| Forecast accuracy shrinks over time | Short-term, granular forecasts are more reliable for operational decisions than long-range projections. |
| Interpretability affects adoption | In regulated or risk-sensitive environments, a model no one can explain is a model no one will use. |
Thepscgroup applies these principles directly to public safety operations, helping EMS agencies and municipal leaders build data-driven systems that hold up under real-world conditions. If your agency is ready to move from reactive operations to evidence-based planning, our municipal EMS strategy guide is a practical resource for getting started.

Visit us at thepscgroup.net to learn how we work alongside public safety leaders to build systems that perform when it matters most.