


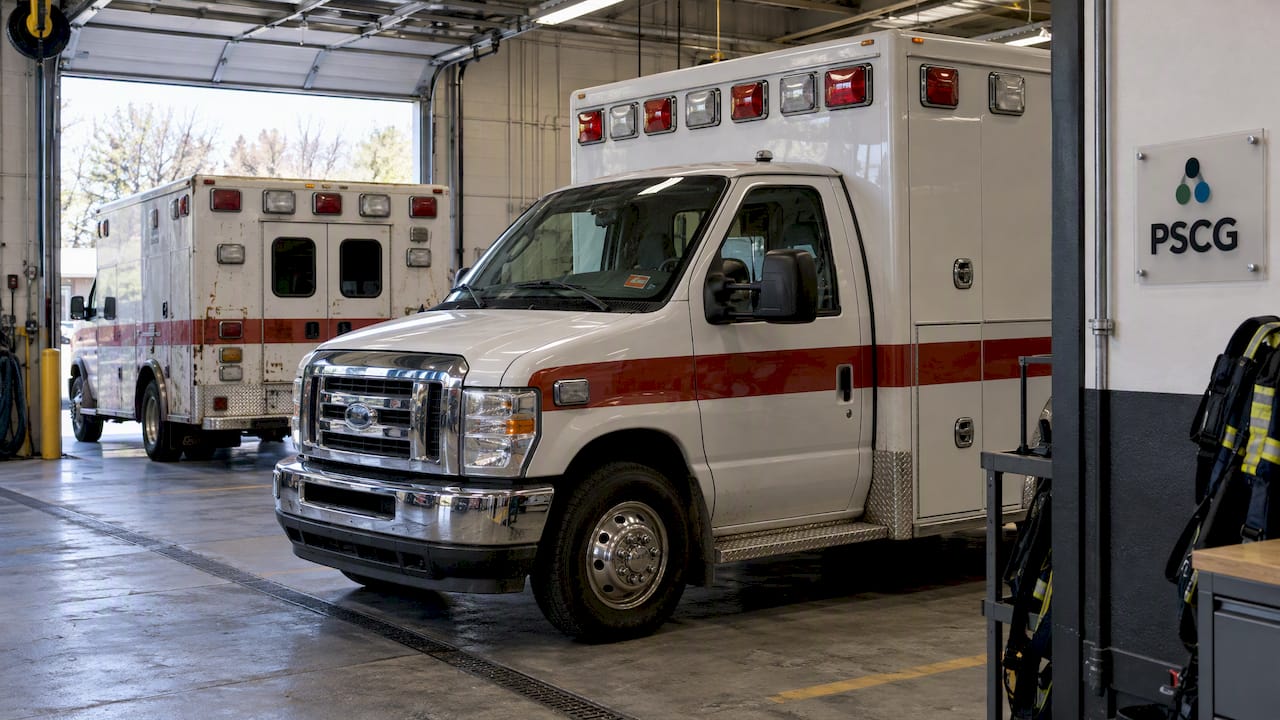
A good starting point for fleet right sizing is to run between 1.4 and 1.6 mission capable units for every peak staffed unit, then adjust that ratio against three levers: your real utilization and demand profile, your surge strategy for short term capacity, and the pace at which you schedule vehicle replacements. We built this guidance from peer reviewed fleet analysis and years of field work with municipal EMS systems.
TL;DR:
- Rural systems with long transport times, mixed urban and rural coverage, or variable demand should favor the higher end; dense urban systems can run lower.
- Use CAD and call logs, unit status timestamps, staffing rosters, maintenance logs, and transport volumes to calculate unit hours, percent busy, and peak demand.
- For peaks tied to seasons or events, compare rentals, mutual aid, and planned overtime with permanent vehicle purchases before expanding the fleet.
- Formal simulation suits major purchases, mergers, or mixed urban and rural coverage, but requires clean timestamps, accurate status codes, and 12 months of call history.
- Limit vehicles undergoing body or chassis work to roughly 10% to 15% of the fleet in any year, and plan reserve coverage.
Table of Contents
- Why the 1.5x Rule Works and How to Adjust It for Your System
- What to Measure: Demand, Utilization, and the Numbers That Drive Sizing
- Modeling Options: Simulation, Queuing, and Simpler Heuristics
- Timing Vehicle Replacements Without Losing Coverage
- Budget, Funding, and the Policy Factors That Shape Right Sizing
- PSCG’s Field-Tested Approach to Peak-Load Staffing
- Why the Conventional Fleet Math Falls Short
- Let’s Build Your Fleet Plan Together
- FAQ
- Sources
Why the 1.5x Rule Works and How to Adjust It for Your System
Most fleets carry 10 to 20 percent more capacity than they actually need, and the 1.4 to 1.6 range builds in just enough slack to absorb that without padding the fleet further.
Rural systems with long transport times often need the higher end of the range because a single breakdown can strand a wide coverage area. Mixed urban-rural systems and high-variability call volumes also justify leaning toward 1.6, while dense urban systems with short backup travel times can often run closer to 1.4.
- A small municipal department staffing 4 peak units typically needs 6 mission capable vehicles at a 1.5x ratio.
- A mid-size county system staffing 12 peak units typically needs 17 to 19 mission capable vehicles depending on its demand variability.
Pro Tip: Recalculate your ratio every time you add a new station or change shift length. Both shift coverage changes and demand often move faster than fleet budgets do.
What to Measure: Demand, Utilization, and the Numbers That Drive Sizing
Before you touch a spreadsheet, pull five data sources: CAD and call logs, unit status timestamps, shift staffing rosters, maintenance logs, and transport volumes. These give you the raw material for every calculation that follows.
- Calculate unit hours by multiplying scheduled units by shift length for each day in your study period.
- Calculate percent busy by dividing total time units spent on calls by total unit hours.
- Identify peak staffed hours by charting call volume by hour and day of week to find your true demand ceiling, not just your average.
- Convert peak staffed hours into required mission capable units using your adjusted ratio from the previous section.
Most fleets carry 10 to 20 percent excess capacity, which means the gap between what you measure and what you currently own is often larger than leaders expect once the data is laid out.
For short-term peaks, rentals, mutual aid agreements, and planned overtime usually cost less than adding permanent vehicles, especially when the peak is seasonal or tied to a predictable event rather than a structural shift in demand.
Modeling Options: Simulation, Queuing, and Simpler Heuristics
Rules of thumb get you close. When precision matters, three analytic approaches can refine the number further.
- Discrete-event simulation models your system hour by hour and tests how different fleet sizes perform under real call patterns.
- Adjusted queuing methods correct a known weakness in classic queuing models: in mixed urban-rural regions, standard Q-models tend to overestimate required ambulances, and a workload-based adjustment brings the estimate closer to reality.
- Heuristic tools like penalty-based redeployment metrics and isochrone mapping give directional answers fast, without the cost of a full simulation build.
Simpler heuristics usually suffice for single-jurisdiction systems with stable call patterns. A formal simulation earns its cost when you’re planning a multi-year capital purchase, merging systems, or redesigning coverage across a mixed urban-rural region. Before commissioning that work, confirm your data is clean: complete CAD timestamps, accurate unit status codes, and at least 12 months of call history. A solid model should hand back coverage probabilities, response-time percentiles, and recommended fleet sizes under two or three demand scenarios.
Timing Vehicle Replacements Without Losing Coverage
Replacement timing is a sizing decision as much as a maintenance one. A vehicle in the shop for a transmission rebuild is just as unavailable as one you never bought.
- Common replacement triggers include mileage thresholds, rising repair cost per mile, and chassis age beyond manufacturer service support.
- Stagger replacements so no more than roughly 10 to 15 percent of your fleet is out of service for body or chassis work in any 12-month window.
- Plan reserve coverage explicitly during refresh cycles rather than assuming existing spares will absorb the gap.
- Weigh remounting a working box onto a new chassis against a full new build. Remounting typically costs less and moves faster, while a new build resets the full service life and warranty clock.
Pro Tip: Build your replacement schedule before your budget cycle starts, not after. Reactive replacement almost always costs more than planned replacement.
Budget, Funding, and the Policy Factors That Shape Right Sizing
Fleet cost runs on three main drivers: depreciation, insurance, and maintenance, and all three scale directly with fleet size. That’s why the 10 to 20 percent excess capacity finding matters as a starting lens for any budget conversation: trimming that excess often funds a meaningful share of your replacement plan without new revenue.
National data efforts shape this conversation too. NEMSAC has recommended that agencies strengthen cost and utilization reporting, including participation in CMS’s ambulance data collection system, because accurate reporting directly affects funding conversations and future reimbursement policy.
- Leasing can smooth capital outlay for agencies facing a tight budget year.
- Staged purchases spread replacement cost across multiple fiscal years instead of one large capital request.
- Mutual aid partnerships can reduce the permanent fleet size needed to cover rare peak events.
PSCG’s Field-Tested Approach to Peak-Load Staffing
Our team has spent many years working inside municipal EMS systems, and the pattern we see most often is a fleet sized for a worst case day that happens six times a year, not for the system’s actual demand curve. Our System Status Management approach and Peak-Demand Staffing tactics focus on matching unit placement to real-time demand rather than fixed station assignments, which often closes the readiness gap without adding vehicles.
A few signs tell you it’s time to bring in outside analysis:
- Your mutual aid calls have increased over the past two budget cycles without a clear explanation.
- You’re replacing vehicles reactively rather than on a planned schedule.
- Your leadership team is debating fleet additions without current unit-hour data to support the request.
When those signs show up together, a structured Peak-Load Staffing Modeling and Scheduling engagement or a full High Performance EMS system design review can be valuable.
Why the Conventional Fleet Math Falls Short
Most of what gets published on fleet sizing treats the ratio as the whole answer, and that’s where the advice runs thin. The 1.4 to 1.6 multiplier is a reasonable starting point, but it only works when it’s paired with honest utilization data and a replacement schedule that doesn’t collapse under its own backlog. We’ve seen departments hit the right ratio on paper while still failing their response-time targets because their reserve units were aging out faster than the budget allowed for replacement.
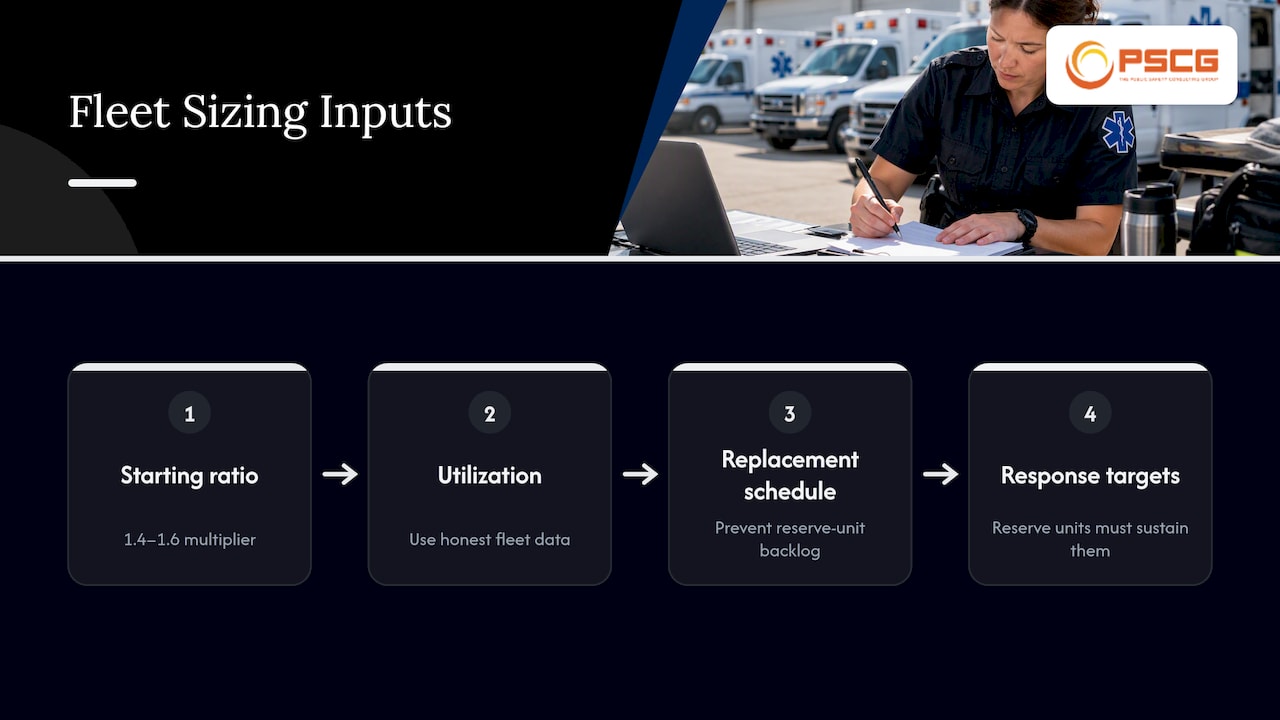
The bigger mistake is treating fleet sizing as a one-time calculation instead of a standing practice. Call patterns shift, stations open and close, and mutual aid relationships change. A ratio calculated three years ago tells you very little about today’s coverage needs.
If we had to pick one priority for a fleet leader reading this, it would be data quality before modeling sophistication. A simple spreadsheet built on clean CAD timestamps and accurate maintenance logs will outperform an expensive simulation built on incomplete data every time.
— Mike
Let’s Build Your Fleet Plan Together
Our team works alongside EMS leaders to turn utilization data into a fleet plan that protects coverage without padding the budget. We bring together system design, status management, peak-load staffing modeling and scheduling, and replacement planning into a single engagement built around your actual call volume and station footprint.
A typical engagement starts with a data review of your CAD logs, unit status history, and maintenance records, moves into a recommended fleet and staffing plan, and finishes with implementation support as you roll changes out across shifts and stations. Most agencies see a draft plan within a few weeks of providing clean data.
- Fleet and demand data review using your CAD, staffing, and maintenance records.
- A recommended mission capable fleet size with reserve guidance specific to your system.
- Implementation support through your next budget and replacement cycle.
Visit The Public Safety Consulting Group to start a conversation about your fleet plan, or reach out through our contact page at Thepscgroup with your current unit count and we’ll help you figure out where to start.
FAQ
What is the right ratio of ambulances to peak staffed units?
A common starting ratio is 1.4 to 1.6 mission capable units for every peak staffed unit, which builds in coverage for maintenance, repairs, and surge events. The exact number should shift based on your terrain, call variability, and how far backup units have to travel.
How much excess capacity do most EMS fleets actually carry?
Research shows most fleets carry 10 to 20 percent more vehicles than their actual demand requires. Right sizing means matching that number down to what your utilization data actually supports.
When should an agency use simulation instead of a simple ratio?
A simple ratio works well for stable, single-jurisdiction systems with consistent call patterns. A formal simulation or adjusted queuing model earns its cost when you’re planning a major capital purchase or managing a mixed urban-rural coverage area where classic models tend to overestimate need.
How often should ambulances be replaced?
Replacement timing depends more on mileage, repair cost trends, and chassis age than on a fixed calendar, and staggering replacements protects coverage during refresh cycles. Keeping no more than roughly 10 to 15 percent of the fleet out of service at once for body or chassis work helps avoid coverage gaps.
What data improves fleet and reimbursement planning the most?
Accurate unit status timestamps, maintenance logs, and cost reporting give you the clearest picture for both fleet sizing and funding conversations. National efforts like NEMSAC’s push for stronger cost and utilization reporting reflect how much funding decisions now depend on data quality.
Sources
- Right-Sizing Fleet Capacity — PMC
- Highlights from February meeting of the National EMS Advisory Council (NEMSAC)
- Demand-point constrained EMS vehicle allocation problems for regions with both urban and rural areas — CWI