




Data analytics is the multidisciplinary process of collecting, organizing, and examining raw data to extract insights that drive informed decisions and measurable organizational growth. Whether you are managing a municipal EMS system, running a retail operation, or building a career in technology, understanding how data works is no longer optional. The field organizes into four primary types, each answering a distinct question:
- Descriptive analytics: What happened? (Summarizes historical data through reports and dashboards)
- Diagnostic analytics: Why did it happen? (Identifies root causes through drill-down and correlation)
- Predictive analytics: What will happen? (Uses statistical models and machine learning to forecast outcomes)
- Prescriptive analytics: What should we do? (Recommends specific actions based on predicted scenarios)
Together, these four types form a progression from observation to action. Most organizations begin with descriptive work and build toward prescriptive capabilities as their data infrastructure matures.
Why data analytics matters for every organization
The clearest argument for investing in analytical capability is this: A significant portion of business leaders struggle to interpret their own data due to complexity or access issues. That gap between data collected and insight acted upon is where organizations lose ground to competitors who have built the capacity to translate numbers into decisions.
The practical benefits span every industry:
- Better decisions: Data-driven choices replace gut instinct with evidence, reducing costly errors in resource allocation and planning.
- Operational efficiency: Identifying process bottlenecks through call volume analysis, staffing patterns, or supply chain metrics allows leaders to redirect resources where they produce the most impact.
- Customer experience: Retailers and healthcare systems alike use behavioral data to personalize service, reducing churn and improving satisfaction scores.
- Marketing precision: Campaign performance data tells you which channels, messages, and timing combinations actually convert, rather than which ones feel right.
- Risk reduction: Predictive models flag anomalies before they become crises, whether that means fraud detection in finance or equipment failure in field operations.
Pro Tip: Start with one specific business question before choosing a tool or technique. The question shapes the method, not the other way around.
The competitive advantage is real and widening. Organizations that treat data as a core operational asset, and develop analytics strategies aligned with specific business goals, consistently achieve better outcomes than those that treat reporting as an afterthought.
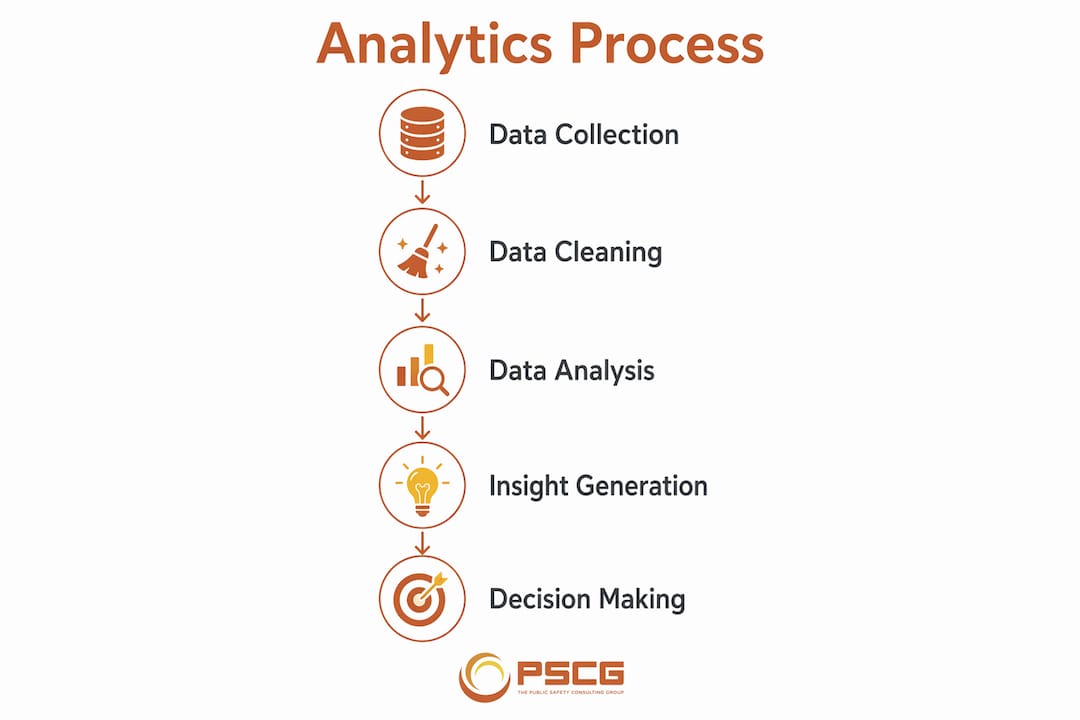
Understanding the types and key concepts of data analytics
The four types in depth
Descriptive analytics is where every organization starts. It answers “what happened” by aggregating historical records into summaries: monthly call volumes, quarterly revenue, year-over-year response time averages. The output is typically a dashboard or a standard report. The limitation is that it tells you the score without explaining the game.

Diagnostic analytics goes one layer deeper. Analysts use techniques like drill-down queries, data filtering, and correlation analysis to identify why a metric moved. If EMS response times spiked in a particular district during a specific month, diagnostic work traces that spike to its source, whether that is a staffing shortage, a routing change, or a surge in call volume from a specific zip code.
Predictive analytics applies statistical models and machine learning algorithms to historical patterns to forecast what is likely to happen next. A hospital system might predict patient admission volumes by season; a fire department might model which neighborhoods face elevated risk during dry weather. The accuracy of these models depends directly on the quality and completeness of the underlying data.
Prescriptive analytics is the most advanced type. It does not just forecast; it recommends. Given a predicted surge in EMS call volume next Tuesday, a prescriptive model might recommend pre-positioning two additional units in specific geographic zones and adjusting shift start times by 90 minutes. This type of analysis requires strong data infrastructure and experienced analysts who can validate model outputs before acting on them.
The analytics process: from raw data to insight
| Stage | Activity | Common Tools |
|---|---|---|
| Data collection | Gathering from databases, APIs, sensors, surveys | SQL, Python, IoT platforms |
| Data cleaning | Removing duplicates, correcting errors, handling missing values | Python (pandas), R, OpenRefine |
| Data integration | Merging datasets from multiple sources | ETL pipelines, SQL joins |
| Exploratory analysis | Identifying patterns, distributions, outliers | R, Python (matplotlib, seaborn) |
| Modeling | Applying statistical or machine learning methods | Python (scikit-learn), R |
| Visualization | Communicating findings to stakeholders | Tableau, Power BI |
| Decision and action | Translating insight into operational change | Leadership, communication |
Data quality: the foundation everything else rests on
Inaccurate or inconsistent data spread across organizational silos produces flawed insights regardless of how sophisticated the analysis is. Errors, duplicates, and missing values are the most common barriers to reliable outcomes. Rigorous cleaning and validation before modeling is not a preliminary step; it is the work.
One concept worth understanding here is Simpson’s paradox: aggregate data trends can reverse or disappear when you break results down by subgroup. A treatment that appears effective across a full patient population may actually perform worse than the alternative in every individual age group, because the groups are distributed unevenly. Careful segmentation prevents this kind of misinterpretation.
A note on big data
Big data analytics differs from traditional analysis in the volume, velocity, and variety of the datasets involved. Social media streams, IoT sensor feeds, and real-time transaction logs cannot be processed in a standard relational database. Distributed processing frameworks like Apache Hadoop and Apache Spark were built specifically for this scale, allowing organizations to run analyses across datasets that would overwhelm conventional infrastructure.
| Dimension | Traditional analytics | Big data analytics |
|---|---|---|
| Data volume | Gigabytes to terabytes | Petabytes and beyond |
| Data structure | Primarily structured (tables, rows) | Structured, semi-structured, unstructured |
| Processing approach | Single-server relational databases | Distributed frameworks (Hadoop, Spark) |
| Update frequency | Batch processing (daily, weekly) | Real-time or near-real-time streams |
| Common sources | CRM, ERP, spreadsheets | Social media, IoT, clickstreams, logs |
Which tools and techniques do analysts actually use?
Core tools
SQL is the foundational language for querying structured databases. Every analyst, regardless of specialty, needs SQL fluency. It handles data extraction, filtering, aggregation, and joining across relational tables. For most organizations, SQL is the first tool that touches the data.
Python has become the dominant language for data science work in the United States. Its libraries, including pandas for data manipulation, scikit-learn for machine learning, and matplotlib and seaborn for visualization, cover the full analytical workflow. Python’s readability makes it accessible to analysts who are not career software engineers.
R was built by statisticians for statistical computing, and it still leads in certain academic and research contexts. Its visualization library, ggplot2, produces publication-quality graphics. For analysts working in public health, clinical research, or social science, R often remains the preferred environment. SQL, Python, and R together form the core technical toolkit for data professionals in the US.
Tableau specializes in interactive data visualization. It connects to most data sources and allows analysts to build dashboards that non-technical stakeholders can explore without writing a single line of code. Tableau supports both traditional datasets and big data sources, making it one of the most widely deployed business intelligence tools in enterprise environments.
Oracle provides enterprise-grade database management and analytics infrastructure. Large organizations, including government agencies and hospital networks, rely on Oracle’s platforms for data warehousing, reporting, and integrated analytics at scale.
Common analytical techniques
- Regression analysis quantifies the relationship between variables, such as how call volume correlates with response time, and is used to predict outcomes based on input changes.
- Clustering groups data points by similarity without predefined labels, useful for segmenting patients by risk profile or customers by purchasing behavior.
- Time series analysis examines data ordered by time to identify trends, seasonal patterns, and anomalies, a standard method in EMS demand forecasting.
- Cohort analysis tracks a defined group of users or cases over time, revealing how behavior or outcomes evolve after a specific event or intervention.
- Classification assigns data points to predefined categories, such as flagging a 911 call as high-priority or low-priority based on caller characteristics and location data.
- Sentiment analysis processes text data, such as patient feedback or social media posts, to determine emotional tone and surface emerging concerns.
These techniques are not interchangeable. The right choice depends on the structure of your data, the question you are answering, and the action you intend to take with the result.
| Tool | Primary strength | Typical use case |
|---|---|---|
| SQL | Structured data querying | Database extraction, reporting |
| Python | Full-cycle data science | Modeling, automation, visualization |
| R | Statistical computing | Research, clinical analysis, ggplot2 graphics |
| Tableau | Interactive visualization | Executive dashboards, stakeholder reporting |
| Oracle | Enterprise data management | Data warehousing, large-scale operations |
How data analytics plays out in the real world
The gap between theory and practice closes fast when you look at specific outcomes. Across industries, organizations that commit to data-informed operations see measurable shifts in performance.
In healthcare and EMS, predictive demand modeling allows dispatch centers to pre-position units based on anticipated call volume by time of day, day of week, and geographic zone. The result is shorter response times without adding vehicles or personnel. Thepscgroup’s own work in this space produced a 12% reduction in EMS response times documented in 2026, a direct outcome of applying data-driven analysis to 911 call patterns and unit deployment decisions.
In retail and e-commerce, customer segmentation models identify which buyers are at risk of churning, allowing targeted retention offers before the relationship ends. Supply chain analytics flags inventory shortfalls weeks before they affect fulfillment.
In marketing, attribution modeling answers the question that has frustrated advertisers for decades: which touchpoint actually drove the conversion? Moving from last-click attribution to multi-touch models changes budget allocation decisions substantially.
Key performance indicators that organizations commonly track through analytics programs include:
- Response time benchmarks (EMS, customer service, logistics)
- Cost per acquisition and customer lifetime value (marketing and sales)
- Equipment utilization rates and maintenance intervals (operations)
- Staff productivity metrics and overtime ratios (workforce management)
- Incident frequency and severity trends (risk and safety)
The common thread across all of these applications is not the tool or the technique. It is the organizational commitment to asking a specific question, collecting the right data to answer it, and acting on the result.
What does a career in data analytics look like?
The field offers a range of roles, from entry-level analyst positions to senior data science and engineering functions. The Bureau of Labor Statistics tracks related roles including operations research analysts, a category that reflects the applied, decision-support nature of much analytical work.
Core roles
- Data analyst: Queries databases, builds reports, and translates findings for business stakeholders. SQL and Excel are baseline; Python or R adds significant value.
- Business intelligence analyst: Focuses on dashboards and reporting infrastructure, often working closely with Tableau, Power BI, or Oracle analytics platforms.
- Data scientist: Builds predictive and machine learning models, typically requiring Python or R proficiency and a background in statistics or applied mathematics.
- Data engineer: Designs and maintains the pipelines that move data from source systems to analytical environments. SQL, Python, and cloud platform experience are standard.
- Analytics manager: Leads teams, sets analytical priorities, and translates organizational strategy into data questions. Communication and stakeholder management are as important as technical skill.
Skills you need to build
Technical skills:
- SQL for database querying and data extraction
- Python or R for statistical analysis and modeling
- Data visualization using Tableau or similar platforms
- Understanding of data cleaning and preprocessing methods
- Familiarity with cloud platforms such as AWS, Google Cloud, or Azure
Soft skills:
- Data storytelling: the ability to explain a finding to someone who did not run the analysis
- Critical thinking: questioning assumptions in the data before drawing conclusions
- Communication: writing and presenting findings clearly to non-technical audiences
Certifications and learning paths
Common certifications that validate analytical competency include CompTIA Data+, Cloudera Data Analyst certification, and vendor-specific credentials from Google, Microsoft, and AWS. Harvard Business School’s Executive Education programs also offer applied analytics training for professionals moving into data-intensive leadership roles.
Pro Tip: Build a portfolio of real projects before applying for analyst roles. A GitHub repository with three well-documented analyses demonstrates more than any certification alone.
The field rewards continuous learning. Tools evolve, techniques improve, and the questions organizations need answered grow more complex each year. Analysts who combine technical depth with genuine curiosity about the problems they are solving tend to advance faster than those who treat the work as purely technical.
Data analytics in EMS and public safety: expert insights from Thepscgroup
Public safety is one of the highest-stakes environments for data analytics. When the analysis is wrong, or when leaders lack the capacity to act on what the data shows, the consequences are measured in response times, patient outcomes, and community trust. Thepscgroup works directly at this intersection, bringing structured analytical frameworks to EMS system design, municipal strategy, and operational risk reduction.

Our analytics-driven approach to EMS integrates call volume data, unit deployment records, response time benchmarks, and System Status Management principles to identify performance gaps and design corrective strategies. The 12% response time improvement documented in 2026 came from applying diagnostic and predictive analytics to 911 call data, not from adding resources, but from deploying existing resources more precisely.
Compliance and data governance matter here as well. EMS agencies operate under federal and state reporting requirements, and the data they collect carries privacy obligations under frameworks like the California Consumer Privacy Act and analogous state-level regulations. Thepscgroup helps agencies build analytics programs that meet these obligations while still producing the operational insight leaders need.
For public safety leaders who want to understand how EMS system design connects to data strategy, the path forward starts with a performance gap analysis: where are your current response times, what does your call volume distribution look like by hour and geography, and where do your unit deployment patterns diverge from actual demand? Those three questions, answered with real data, define the analytical work that follows.
Pro Tip: If your agency collects data but your leadership team cannot describe what question that data answers, that is the gap to close first. Analytics capability starts with organizational clarity about what you are trying to learn.
| Point | Details |
|---|---|
| Four types drive decisions | Descriptive, diagnostic, predictive, and prescriptive analytics each answer a distinct question and build on one another. |
| Data quality determines outcomes | Errors, duplicates, and siloed data produce flawed insights regardless of the sophistication of the analysis applied. |
| Core tools for US analysts | SQL, Python, R, Tableau, and Oracle cover the full range of analytical work from querying to visualization. |
| EMS response times improved 12% | Predictive analytics applied to 911 call data produced a 12% reduction in EMS response times in 2026 according to Thepscgroup’s internal analysis. |
| Many leaders struggle with data | The critical gap is not data volume but the organizational capacity to interpret and act on what the data shows. |
Thepscgroup is a Connecticut-based EMS and public safety consulting firm. To learn how we apply data analytics to public safety challenges in your community, visit us at thepscgroup.net or explore our municipal EMS strategy resources.