



Fractile response time measures the point at which 90 percent of your emergency calls receive a unit, from call receipt to arrival, and it exposes system reliability in ways an average never can. If you manage an EMS agency, fire department, or municipal emergency program, your first move should be simple: pull existing CAD timestamps and calculate your own 90th-percentile interval before you change anything else. That single number tells you more about your worst-case performance than months of anecdotal complaints ever will.
TL;DR:
- Standardizing CAD timestamp definitions is essential to accurately calculate the 90th-percentile response time and identify specific delays within response processes.
- Tailoring response benchmarks based on agency size, geographic area, and call volume mix improves the accuracy of performance targets rather than relying on national averages.
- Improving the 90th percentile involves addressing specific system failures such as dispatch delays, travel inefficiencies, or offload holdups, rather than just increasing staffing.
- Implementing real-time system status management and triage-based dispatch can significantly reduce fractile times and enhance overall response reliability.
- Conducting a baseline fractile assessment before adopting new technology allows agencies to measure actual improvements and avoid ineffective investments.
Table of Contents
- What Is Fractile Response Time EMS Measurement?
- What Response Time Benchmarks Should Your System Target?
- Where Does Response Time Actually Get Lost?
- Which Interventions Actually Move the Fractile Number?
- How Do You Govern Fractile Data So It Stays Trustworthy?
- What Does a 12-Month Implementation Timeline Look Like?
- What Consulting Support Looks Like for Fractile Improvement
- Get a Fractile Baseline Diagnostic From Thepscgroup
- Sources
- FAQ
What Is Fractile Response Time EMS Measurement?
Fractile response time EMS measurement, more precisely called percentile or fractile-based response time analysis, answers a question mean averages hide: how bad does it get for the calls at the back of the line? A mean can look respectable while one in ten patients waits far longer than anyone would accept. The 90th percentile forces that reality into view.
Calculating it is straightforward. Pull every call interval for a given period, sort the times from fastest to slowest, and identify the value below which 90 percent of calls fall. If you handled 1,000 calls last quarter, your 90th-percentile time is the 900th-fastest result, not the average of all 1,000.
Before you trust that number, standardize your clock definitions:
- Call receipt to dispatch: when the call taker gets enough information to assign a unit
- Dispatch to turnout: when the crew acknowledges and begins rolling
- Turnout to arrival: actual travel time to the scene
- Total response: call receipt through arrival, the interval most benchmarks reference
Mixing these definitions across shifts or vendors is the fastest way to produce a fractile that misleads your own command staff. Our guide on response time analysis for public safety professionals walks through cleaning CAD exports before you calculate anything.
What Response Time Benchmarks Should Your System Target?
NFPA 1710 sets turnout time guidance for EMS calls and structures its response benchmarks around a 90th-percentile standard for career departments, while NFPA 1221 governs dispatch processing time within communication centers. Neither standard was designed as a one-size-fits-all number for every agency, and applying an urban career-department benchmark to a rural volunteer system without adjustment sets leadership up to fail against a target that was never realistic for their geography.
The variability is the real story. NEMSQA and NEMSIS analysis found substantial national variation in EMS quality measures depending on agency size and urbanicity, which means your benchmark should come from agencies with a comparable call mix and coverage area, not a national average.
Tailor your fractile targets considering factors such as population density, travel distances, call volume mix, and mutual aid agreements.
Where Does Response Time Actually Get Lost?
Total response time breaks into distinct intervals, and each one fails for a different reason. Improving the fractile requires knowing which segment is actually broken, because throwing staffed units at a dispatch-processing problem wastes money without moving the number.
- Call processing delays happen when call takers gather excessive information before dispatch, or when CAD software introduces lag between call receipt and unit assignment.
- Turnout time failures stem from crew notification gaps, station layout, or fatigue during overnight shifts, and they are often the single most fixable interval.
- Travel time problems trace back to poor unit positioning, outdated street network data, or the absence of any real-time repositioning strategy.
- Hospital offload delays strand ambulances at emergency department bays, quietly consuming unit hours that never show up as “response time” but directly shrink the pool of available units.
- Recall and closest-unit failures occur when crews get pulled back to quarters or a farther unit is dispatched instead of the closest available one, doubling travel distance for no operational reason.
Lost unit hours from offload delays and poor recall discipline often do more damage to your fractile than any single slow drive. A JEMS industry analysis identifies component-time management and lost unit hours as two of the five essential levers agencies control directly.
Which Interventions Actually Move the Fractile Number?
The agencies that improve their 90th-percentile response time consistently pair better technology with disciplined process change. No single tactic fixes a fractile alone, but four proven levers work together.
System Status Management (SSM) uses real-time AVL and MDT data to reposition ambulances dynamically based on predicted demand rather than fixed station assignments. Research on AVL-driven SSM shows this approach improves coverage and reduces recall rates when agencies commit to the data infrastructure it requires.
Priority dispatch through AMPDS or ProQA lets call takers triage by acuity instead of treating every call identically. Analysis of triage-based dispatch links these systems to better ambulance allocation, because low-acuity calls get routed to alternative resources instead of consuming a transport unit that a cardiac arrest might need next.
Alternative response pathways including nurse triage lines, telehealth consults, and non-transport units reduce demand on your transport fleet. The CMS Emergency Triage, Treat, and Transport model formally recognizes these pathways as legitimate tools for improving system efficiency.
Peak-load staffing matches crew availability to actual demand curves instead of flat 24-hour shift blocks, a tactic covered in our peak demand staffing guide.
- Adopt AVL/MDT before committing to full SSM redeployment
- Secure medical director sign-off before rolling out tiered ALS/BLS dispatch
- Pilot alternative pathways in your highest-volume, lowest-acuity call category first
Pro Tip: Run your AMPDS pilot alongside your current dispatch protocol for 60 days before switching over completely. Agencies that skip parallel testing often discover triage miscalibration only after it has already affected patient care.
How Do You Govern Fractile Data So It Stays Trustworthy?
A fractile number is only as good as the data feeding it, and inconsistent timestamp definitions across shifts or vendors quietly corrupt every calculation downstream. Standardize your data dictionary using NEMSIS field definitions and make your CAD system the single source of truth, not a patchwork of station logs and radio traffic.
Segment your fractile reporting by call type. A blended 90th-percentile figure across cardiac arrests and non-emergency transfers hides the number that actually matters to a family waiting on a stroke call.
One number is never the whole story. A joint position statement from NAEMT and partner organizations warns that chasing response time alone can drive up costs and safety risk. The statement recommends pairing fractile targets with clinical outcome measures, safety incident tracking, and patient experience data.
- Set up formal CQI or peer review tied to fractile outliers, not just averages
- Track offload delay separately from response time so it does not get buried
- Avoid compensation or incentive structures tied solely to response-time performance
Our EMS performance metrics guide breaks down how to build that balanced scorecard without losing sight of the fractile itself.
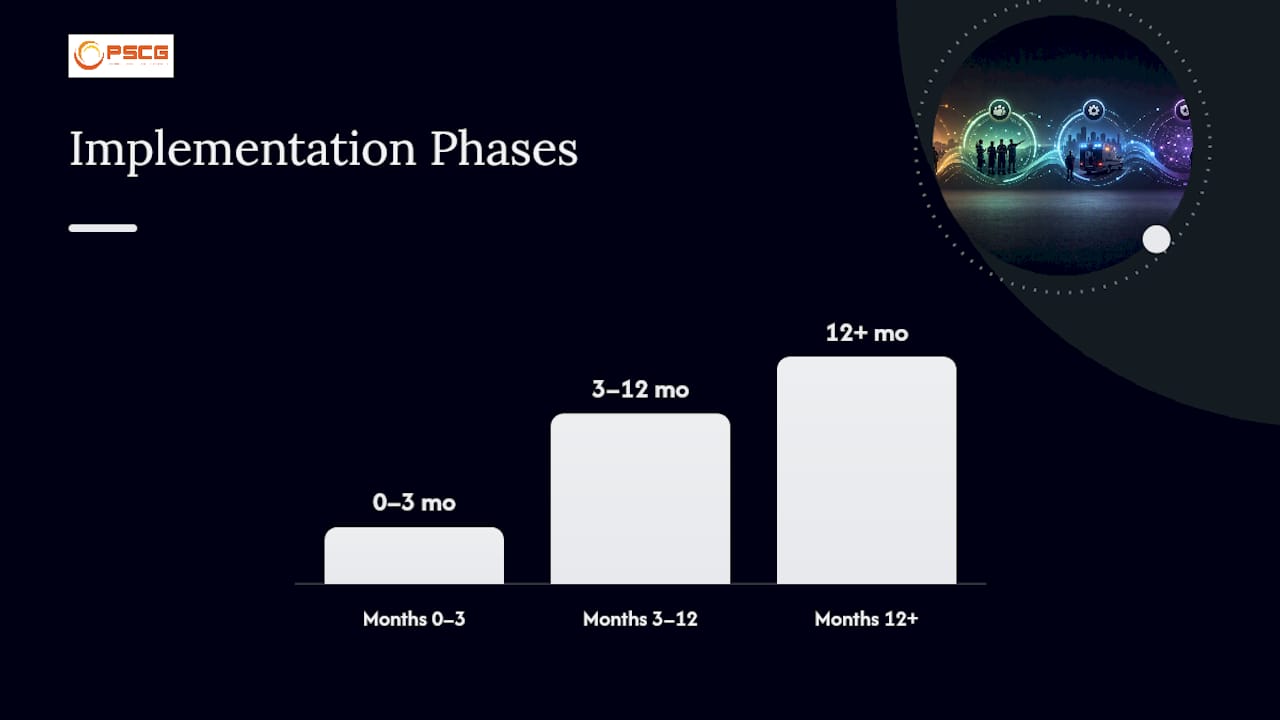
What Does a 12-Month Implementation Timeline Look Like?
Improving your fractile response time is a sequence, not a single project, and each phase depends on the discipline of the one before it.
- Months 0 to 3: Clean your CAD timestamp definitions, calculate your true baseline fractile, enforce closest-unit dispatch policy, and tighten recall rules so dispatch can override a field recall when a closer unit exists on the CAD screen.
- Months 3 to 12: Roll out AMPDS or ProQA priority dispatch with medical director approval, pilot SSM in your highest-demand zone, and adjust staffing models to match demand curves instead of flat shift blocks.
- 12 months and beyond: Expand SSM countywide if mutual aid partners are willing, standardize QA/QI processes across the region, and align funding and reimbursement strategy with the operational model you have built.
Agencies that skip the quick wins and jump straight to SSM software purchases often stall, because a dispatch center with inconsistent timestamps cannot validate whether the new technology is working. Fix the data first.
Pro Tip: Before signing any technology contract, run a 90-day fractile baseline using your current process. Without it, you have no way to prove the new system actually improved anything.
What Consulting Support Looks Like for Fractile Improvement
Consulting approaches to fractile improvement typically start with a baseline audit followed by targeted design work. These engagements often include a response-time baseline audit, system status management design tailored to call volume and geography, peak-load staffing modeling, and a deployment plan that integrates these elements. The Montgomery County Strategic EMS Assessment provides an example of thorough work, featuring recommendations on AVL adoption, AMPDS rollout, and standardized QA/QI. When evaluating consultants, it is important to request pre and post fractile comparisons to demonstrate impact, rather than relying solely on narrative reports.
— Mike
Get a Fractile Baseline Diagnostic From Thepscgroup
Thepscgroup gives municipal leaders and EMS agencies something a generic software vendor cannot: consultants who have designed deployment plans and staffing models in the field, not just built dashboards. If your agency has never calculated a true 90th-percentile response time using clean CAD data, that gap is the first thing worth closing.
Thepscgroup offers a diagnostic engagement built around exactly what this article covers: calculating your current fractile from existing CAD timestamps, identifying which component interval is dragging your number down, and producing a one-page deployment playbook your command staff can act on immediately. That scope typically runs a few weeks depending on data availability, not months. From there, agencies move into deeper work like System Status Management design or operational risk reduction based on what the diagnostic finds. Visit Thepscgroup to scope a diagnostic for your agency and get your baseline number on the table.
Sources
- (PubMed) Study on AVL/SSM approaches and coverage optimization
- (PMC) Dispatch triage and alternative response pathways analysis
- Joint Position Statement on EMS Performance Measures Beyond Response Times (NAEMT et al.)
This article is general information, not a substitute for advice from a qualified doctor. Consult a qualified healthcare professional about your own circumstances before acting on anything here.
FAQ
What Is Fractile Response Time in EMS?
Fractile response time, most commonly the 90th percentile, measures the interval within which 90 percent of your calls receive a unit, exposing reliability that a mean average hides.
Why Use the 90th Percentile Instead of an Average?
An average can look acceptable while a meaningful share of calls wait far longer than acceptable; the fractile method reveals that worst-case reliability directly.
What Does NFPA 1710 Say About Response Times?
NFPA 1710 sets turnout time guidance for EMS calls and structures its response benchmarks around a 90th-percentile standard for career departments.
How Does System Status Management Improve Fractile Scores?
SSM uses real-time AVL and MDT data to reposition ambulances based on predicted demand, which research links to improved coverage and fewer recalls.
How Can Thepscgroup Help Improve Our Fractile Response Time?
Thepscgroup offers a diagnostic engagement that calculates your current fractile from CAD data and delivers a deployment playbook; pricing is available by contacting the team directly at Thepscgroup.